![]()
Enterprise-grade 3D multi-level map visualization framework
![]()


Features • Demo • Quick Start • Docs • Examples • Contributing

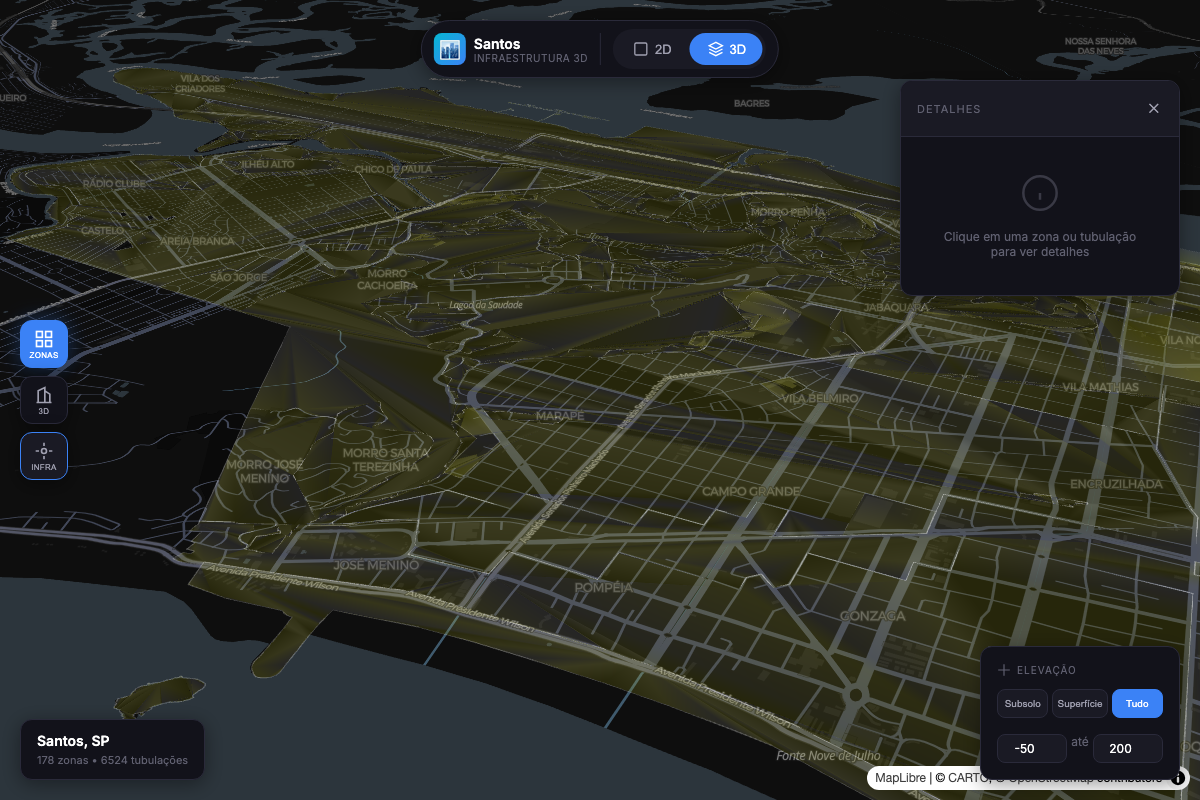
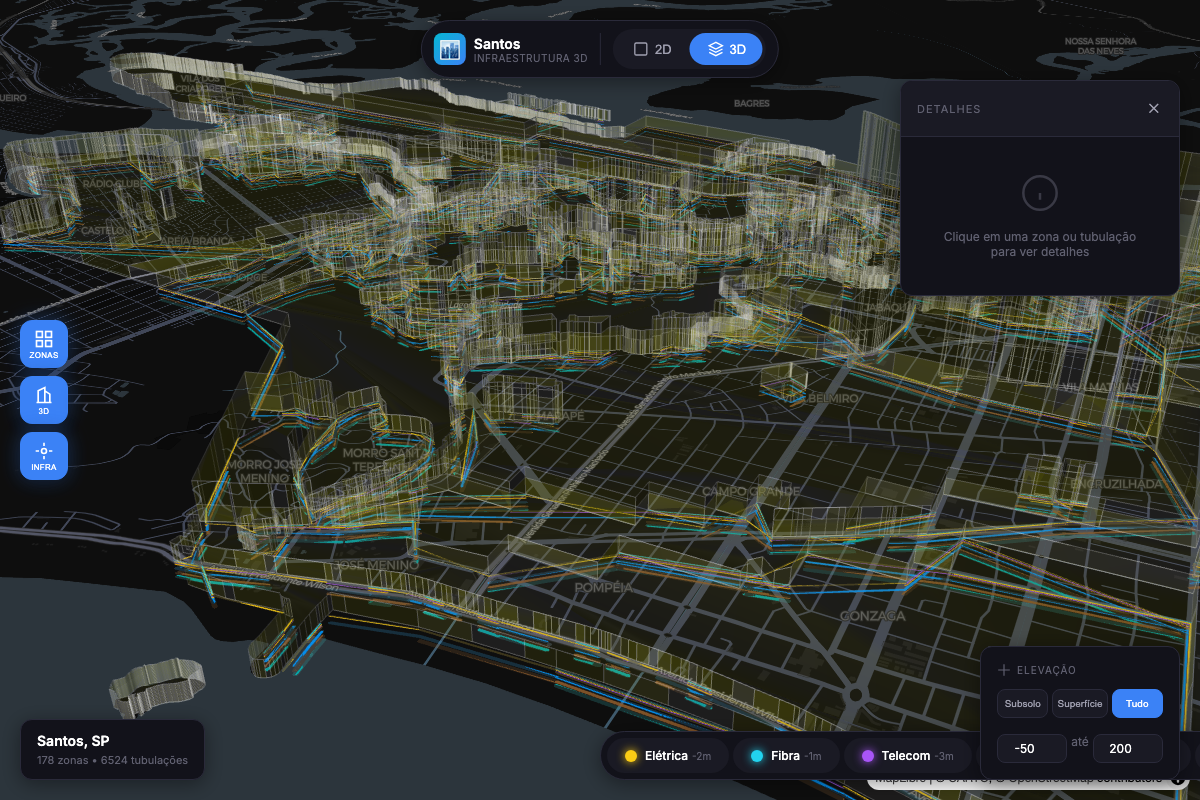
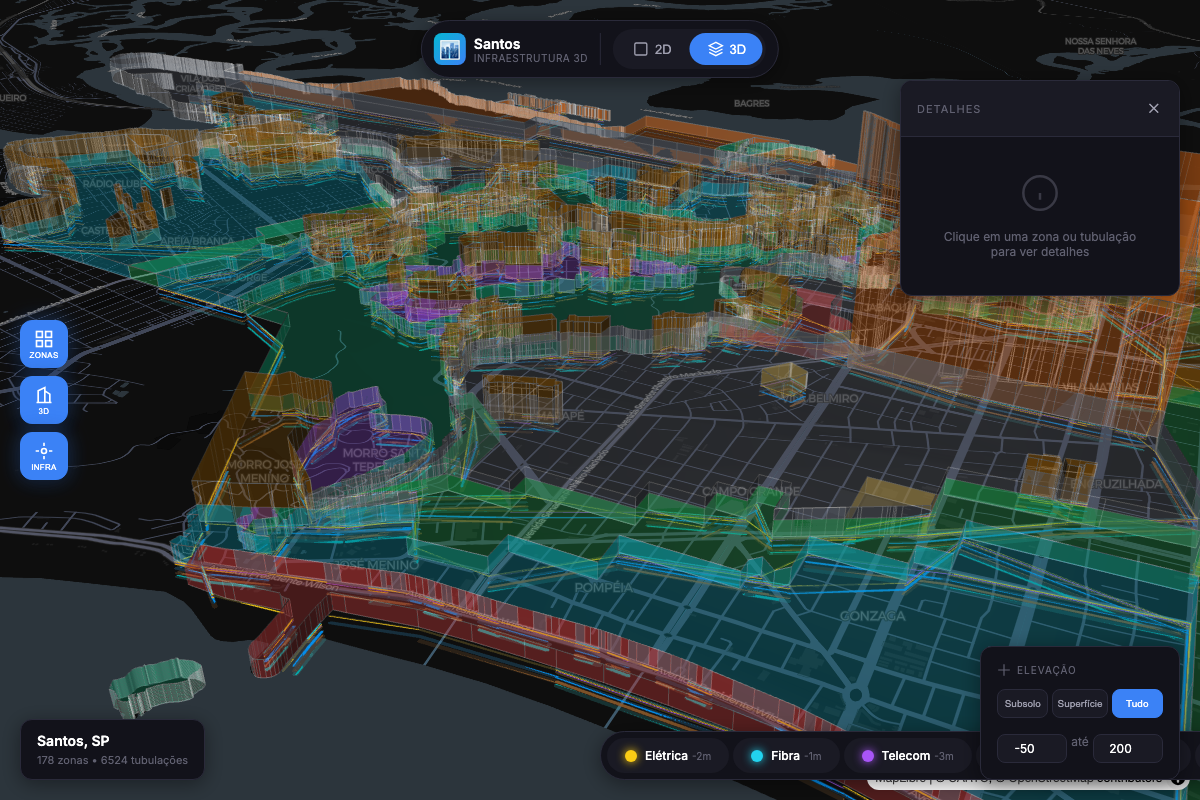
Demo: 3D urban visualization with zoning, buildings, and underground infrastructure
map-3d-deck is a framework-agnostic library for building immersive 3D map visualizations with multi-level support. It combines the power of Deck.gl for high-performance WebGL rendering with MapLibre GL for beautiful base maps.
Built for urban planning, smart city applications, and geospatial analysis, it enables visualization of data from underground infrastructure (-50m) to skyscrapers (+200m) in a single, unified view.
Works anywhere in the world — Just provide GeoJSON data following the documented schema. The library handles coordinates, projections, and rendering automatically for any geographic location.
| Challenge | Solution |
|---|---|
| Complex urban data at multiple elevations | Unified elevation system from -50m to +200m |
| Framework lock-in | Framework-agnostic — works with React, Vue, Angular, or Vanilla JS |
| Performance with large datasets | WebGL-powered rendering via Deck.gl handles 100k+ features |
| Learning curve | Simple API — get started in 3 lines of code |
- Multi-Level Visualization — Seamlessly navigate from underground utilities to surface zoning to aerial building views
- Framework Agnostic — First-class support for React, Vue, Angular, Svelte, and Vanilla JavaScript
- High Performance — WebGL-accelerated rendering handles 100,000+ features at 60fps
- Type-Safe — Full TypeScript support with comprehensive type definitions
- Customizable — Extensive styling options and callback hooks for complete control
| Layer | Description | Use Case |
|---|---|---|
ZoningLayer |
Urban zoning polygons with 3D extrusion | Land use visualization, urban planning |
BuildingLayer |
3D building footprints with height data | Skyline analysis, shadow studies |
SubsurfaceLayer |
Underground network lines | Utility mapping, infrastructure planning |
InfrastructureLayer |
Unified factory for infrastructure networks | Water, gas, sewage, electric networks |
| Controller | Description | Feature |
|---|---|---|
PopupController |
Framework-agnostic popup/tooltip system | Hover tooltips, click popups, reverse geocode |
LegendController |
Auto-updating legend based on active layers | Visibility toggles, feature counts |
| Preset | Range | Content |
|---|---|---|
subsurface |
-50m → 0m | Metro lines, utilities, foundations |
surface |
-5m → 5m | Zoning, lots, geotechnical data |
buildings |
0m → 200m | Building heights, aerial structures |
all |
-50m → 200m | Complete vertical profile |
Urban Zoning |
3D Buildings |

Underground Infrastructure |
Combined Multi-Level View |
npm install @raphaeltorquat0/map-3d-deck maplibre-glimport { Map3D, createZoningLayer } from '@raphaeltorquat0/map-3d-deck'
import 'maplibre-gl/dist/maplibre-gl.css'
// Create the map with integrated popup and legend (v0.2.0)
const map = new Map3D({
container: 'map',
initialViewState: {
longitude: -46.3289,
latitude: -23.9608,
zoom: 14,
pitch: 45,
},
popup: { enabled: true, showOnHover: true },
legend: { enabled: true, position: 'top-right' },
})
// Add a zoning layer with 3D extrusion
const zoningLayer = createZoningLayer({
id: 'zoning',
data: '/data/zoning.geojson',
extruded: true,
pickable: true,
})
map.addLayer(zoningLayer)
// Register layer in legend
map.legend.registerLayer({
id: 'zoning',
label: 'Zoneamento',
color: '#3B82F6',
type: 'polygon',
})
// React to popup/legend events
map.popup.onOpen((info) => console.log('Popup:', info))
map.legend.onChange((items) => console.log('Legend:', items))That's it! You now have an interactive 3D map with popups and a legend.
The main class for creating and managing 3D maps.
const map = new Map3D({
  // Required
  container: string | HTMLElement,

  // View State
  initialViewState: {
    longitude: number,
    latitude: number,
    zoom: number,        // default: 12
    pitch: number,       // default: 0 (2D), 45+ for 3D
    bearing: number,     // default: 0
  },

  // Styling
  mapStyle?: string,     // MapLibre style URL

  // Popup Configuration (v0.2.0)
  popup?: {
    enabled?: boolean,        // default: true
    showOnHover?: boolean,    // default: true
    showOnClick?: boolean,    // default: true
    reverseGeocode?: boolean, // default: false
    hoverDelay?: number,      // default: 200ms
    formatContent?: (feature, layerId) => string | Record<string, string>,
  },

  // Legend Configuration (v0.2.0)
  legend?: {
    enabled?: boolean,        // default: true
    position?: 'top-left' | 'top-right' | 'bottom-left' | 'bottom-right',
    showFeatureCount?: boolean,
    showToggle?: boolean,
    title?: string,
  },

  // Events
  onClick?: (info: PickInfo) => void,
  onHover?: (info: PickInfo) => void,
  onViewStateChange?: (viewState: MapViewState) => void,
  onLoad?: () => void,
  onError?: (error: Error) => void,
})
Methods:
| Method | Description |
|---|---|
addLayer(layer) |
Add a layer to the map |
removeLayer(id) |
Remove a layer by ID |
setLayers(layers) |
Replace all layers |
setElevationRange(range) |
Filter visible elevation range |
flyTo(options) |
Animate to a location |
toggle3D(enabled) |
Switch between 2D/3D view |
destroy() |
Clean up resources |
Properties (v0.2.0):
| Property | Type | Description |
|---|---|---|
popup |
PopupController |
Integrated popup/tooltip controller |
legend |
LegendController |
Integrated legend controller |
// Zoning polygons with optional 3D extrusion
createZoningLayer({
  id: string,
  data: FeatureCollection | string,
  extruded?: boolean,      // default: false
  opacity?: number,        // default: 0.7
  elevationScale?: number, // default: 1
  getFillColor?: (f) => [r, g, b, a],
  getHeight?: (f) => number,
})

// 3D building footprints
createBuildingLayer({
  id: string,
  data: FeatureCollection | string,
  extruded?: boolean,      // default: true
  wireframe?: boolean,     // default: false
})

// Underground utility networks
createSubsurfaceLayer({
  id: string,
  data: FeatureCollection | string,
  networkTypes?: string[], // filter: ['water', 'sewage', ...]
  widthMinPixels?: number, // default: 2
})

// Infrastructure networks (unified factory) - v0.2.0
createInfrastructureLayer({
  id: string,
  data: FeatureCollection | string,
  networkType?: 'water' | 'sewage' | 'gas' | 'electric' | 'telecom' | 'drainage' | 'metro',
  preset?: 'utility-line' | 'utility-point' | 'risk-line', // apply pre-defined styles
  pickable?: boolean,
  onClick?: (info) => void,
  onHover?: (info) => void,
})Manage visible elevation ranges programmatically.
import { ElevationController } from '@raphaeltorquat0/map-3d-deck'

const controller = new ElevationController({
  onChange: (range) => map.setElevationRange(range),
})

// Apply presets
controller.applyPreset('subsurface') // -50m to 0m
controller.applyPreset('surface') // -5m to 5m
controller.applyPreset('buildings') // 0m to 200m
controller.applyPreset('all') // -50m to 200m

// Custom range
controller.setRange({ min: -20, max: 50 })

// Query
controller.isVisible(25) // true
controller.getVisibleLevels() // ElevationLevel[]
controller.getCurrentPreset() // 'surface' | nullIntegrated popup/tooltip system that works with any UI framework.
const map = new Map3D({
  container: 'map',
  popup: {
    enabled: true,
    showOnHover: true, // Show tooltip on hover
    showOnClick: true, // Show popup on click
    reverseGeocode: true, // Fetch address automatically
    hoverDelay: 200, // ms before showing tooltip
    formatContent: (feature, layerId) => {
      return formatFeatureProperties(feature.properties, SUBSURFACE_FORMATTERS)
    },
  },
})

// Programmatic control
map.popup.open({ coordinate: [-46.6, -23.5], content: 'Hello World' })
map.popup.close()

// UI callbacks (framework-agnostic)
map.popup.onOpen((info) => {
  // info: { position, feature, layerId, content, address, trigger }
  renderPopupUI(info)
})
map.popup.onClose(() => hidePopupUI())

// Check state
map.popup.isOpen() // boolean
map.popup.getInfo() // PopupInfo | nullAuto-updating legend that reflects active map layers.
const map = new Map3D({
  container: 'map',
  legend: {
    enabled: true,
    position: 'top-right', // 'top-left' | 'bottom-left' | 'bottom-right'
    showFeatureCount: true, // Show count per layer
    showToggle: true, // Enable visibility toggles
    title: 'Camadas',
  },
})

// Register layers for legend
map.legend.registerLayer({
  id: 'water',
  label: 'Rede de Água',
  color: '#3B82F6',
  type: 'line',
  order: 1,
})

map.legend.registerLayer({
  id: 'gas',
  label: 'Rede de Gás',
  color: '#F59E0B',
  type: 'line',
  order: 2,
})

// UI callbacks
map.legend.onChange((items) => {
  // items: [{ layerId, label, color, visible, count, type }]
  renderLegendUI(items)
})

map.legend.onToggle((layerId, visible) => {
  // Update your layer visibility
  const layer = map.getLayer(layerId)
  if (layer) {
    map.updateLayer(layer.clone({ visible }))
  }
})

// Programmatic control
map.legend.toggleLayer('water') // Toggle visibility
map.legend.setLayerCount('water', 150) // Update feature count
map.legend.showAll() // Show all layers
map.legend.hideAll() // Hide all layersDeclarative system for formatting feature properties.
import {
  createFieldFormatters,
  formatFeatureProperties,
  formatDepth,
  formatDiameter,
  formatYear,
  SUBSURFACE_FORMATTERS,
  BUILDING_FORMATTERS,
} from '@raphaeltorquat0/map-3d-deck'

// Create custom formatters
const formatters = createFieldFormatters({
  diameter: { label: 'Diâmetro', format: formatDiameter, order: 1 },
  depth: { label: 'Profundidade', format: formatDepth, order: 2 },
  year_installed: { label: 'Ano', format: formatYear, order: 3 },
  status: {
    label: 'Status',
    format: (v) => ({ active: 'Ativo', inactive: 'Inativo' })[v] || v,
    order: 4,
  },
})

// Format feature properties
const formatted = formatFeatureProperties(feature.properties, formatters)
// Result: [
//   { key: 'diameter', label: 'Diâmetro', value: '150 mm', order: 1 },
//   { key: 'depth', label: 'Profundidade', value: '5 m', order: 2 },
//   ...
// ]

// Use pre-configured formatters
const infraFormatted = formatFeatureProperties(
  feature.properties,
  SUBSURFACE_FORMATTERS
)
const buildingFormatted = formatFeatureProperties(
  feature.properties,
  BUILDING_FORMATTERS
)Pre-defined layer styles for common use cases.
import {
  LAYER_PRESETS,
  getPreset,
  getLinePreset,
  getPolygonPreset,
  mergePresetWithOptions,
} from '@raphaeltorquat0/map-3d-deck'

// Available presets
const presets = {
  'utility-line':   // Lines: width 2-8px, rounded caps, opacity 0.85
  'utility-point':  // Points: radius 4-12px, stroked, opacity 0.9
  'risk-area':      // Polygons: filled, stroked, opacity 0.6
  'building-3d':    // Polygons: extruded, material lighting
  'building-flat':  // Polygons: filled, stroked, no extrusion
  'zoning-3d':      // Polygons: extruded, wireframe, opacity 0.7
  'zoning-flat':    // Polygons: filled, stroked, opacity 0.6
}

// Use with InfrastructureLayer
const waterLayer = createInfrastructureLayer({
  id: 'water',
  data: waterGeoJSON,
  networkType: 'water',
  preset: 'utility-line',  // Applies pre-defined styles
})

// Get and customize preset
const lineConfig = getLinePreset('utility-line')
const customConfig = mergePresetWithOptions(lineConfig, {
  widthMinPixels: 4,
  opacity: 1,
})This example demonstrates the full power of v0.2.0 features - reducing ~600 lines of boilerplate to ~50 lines.
import {
  Map3D,
  createInfrastructureLayer,
  createFieldFormatters,
  formatFeatureProperties,
  formatDepth,
  formatDiameter,
  formatYear,
  INFRASTRUCTURE_NETWORK_COLORS,
} from '@raphaeltorquat0/map-3d-deck'
import 'maplibre-gl/dist/maplibre-gl.css'

// 1. Create formatters for popup content
const formatters = createFieldFormatters({
  diameter: { label: 'Diâmetro', format: formatDiameter, order: 1 },
  depth: { label: 'Profundidade', format: formatDepth, order: 2 },
  material: { label: 'Material', order: 3 },
  year_installed: { label: 'Ano', format: formatYear, order: 4 },
})

// 2. Create map with integrated popup and legend
const map = new Map3D({
  container: 'map',
  initialViewState: {
    longitude: -46.3289,
    latitude: -23.9608,
    zoom: 15,
    pitch: 45,
  },
  popup: {
    enabled: true,
    showOnHover: true,
    showOnClick: true,
    reverseGeocode: true,
    formatContent: (feature) => {
      const fields = formatFeatureProperties(feature.properties, formatters)
      return fields.reduce((acc, f) => ({ ...acc, [f.label]: f.value }), {})
    },
  },
  legend: {
    enabled: true,
    position: 'top-right',
    showFeatureCount: true,
  },
})

// 3. Add infrastructure layers with presets
const networks = ['water', 'gas', 'sewage', 'electric'] as const

networks.forEach((networkType, index) => {
  const layer = createInfrastructureLayer({
    id: networkType,
    data: `/api/geo/infrastructure/${networkType}`,
    networkType,
    preset: 'utility-line',
    pickable: true,
  })

  map.addLayer(layer)

  // Register in legend
  map.legend.registerLayer({
    id: networkType,
    label: networkType.charAt(0).toUpperCase() + networkType.slice(1),
    color: INFRASTRUCTURE_NETWORK_COLORS[networkType],
    type: 'line',
    order: index,
  })
})

// 4. Wire up UI callbacks
map.popup.onOpen((info) => {
  document.getElementById('popup')!.innerHTML = `
    <h3>${info.layerId}</h3>
    <p>${info.address || ''}</p>
    <pre>${JSON.stringify(info.content, null, 2)}</pre>
  `
  document.getElementById('popup')!.style.display = 'block'
})

map.popup.onClose(() => {
  document.getElementById('popup')!.style.display = 'none'
})

map.legend.onChange((items) => {
  document.getElementById('legend')!.innerHTML = items
    .map(
      (item) => `
      <div style="display:flex;align-items:center;gap:8px">
        <span style="width:12px;height:12px;background:${item.color};border-radius:2px"></span>
        <span>${item.label}</span>
        ${item.count ? `<span>(${item.count})</span>` : ''}
      </div>
    `
    )
    .join('')
})

map.legend.onToggle((layerId, visible) => {
  const layer = map.getLayer(layerId)
  if (layer) {
    map.updateLayer(layer.clone({ visible }))
  }
})import { useEffect, useRef } from 'react'
import { Map3D, createZoningLayer } from '@raphaeltorquat0/map-3d-deck'
export function MapComponent({ data }) {
const containerRef = useRef<HTMLDivElement>(null)
const mapRef = useRef<Map3D | null>(null)
useEffect(() => {
if (!containerRef.current) return
mapRef.current = new Map3D({
container: containerRef.current,
initialViewState: {
longitude: -46.63,
latitude: -23.55,
zoom: 12,
pitch: 45,
},
})
return () => mapRef.current?.destroy()
}, [])
useEffect(() => {
if (!mapRef.current || !data) return
mapRef.current.setLayers([
createZoningLayer({ id: 'zoning', data, extruded: true }),
])
}, [data])
return <div ref={containerRef} style={{ width: '100%', height: '100vh' }} />
}<script setup lang="ts">
import { ref, onMounted, onUnmounted, watch } from 'vue'
import { Map3D, createZoningLayer } from '@raphaeltorquat0/map-3d-deck'
const props = defineProps<{ data: FeatureCollection }>()
const container = ref<HTMLDivElement>()
let map: Map3D | null = null
onMounted(() => {
if (!container.value) return
map = new Map3D({
container: container.value,
initialViewState: {
longitude: -46.63,
latitude: -23.55,
zoom: 12,
pitch: 45,
},
})
})
onUnmounted(() => map?.destroy())
watch(
() => props.data,
(data) => {
map?.setLayers([createZoningLayer({ id: 'zoning', data, extruded: true })])
}
)
</script>
<template>
<div ref="container" class="w-full h-screen" />
</template>'use client'
import dynamic from 'next/dynamic'
const Map = dynamic(() => import('./Map'), { ssr: false })
export default function Page() {
return <Map />
}┌─────────────────────────────────────────────────────────────────────────┐
│ map-3d-deck v0.2.0 │
├─────────────────────────────────────────────────────────────────────────┤
│ │
│ ┌──────────────────────────────────────────────────────────────────┐ │
│ │ Map3D (Core) │ │
│ │ ┌────────────────┐ ┌────────────────┐ ┌────────────────────┐ │ │
│ │ │ PopupController│ │LegendController│ │ElevationController │ │ │
│ │ │ (Integrated) │ │ (Integrated) │ │ (Standalone) │ │ │
│ │ └────────────────┘ └────────────────┘ └────────────────────┘ │ │
│ └──────────────────────────────────────────────────────────────────┘ │
│ │ │
│ ┌─────────────────┐ ┌────────────┴────────────┐ ┌─────────────────┐ │
│ │ Layers │ │ Formatters │ │ Presets │ │
│ │ Zoning │ │ formatDepth() │ │ utility-line │ │
│ │ Building │ │ formatDiameter() │ │ building-3d │ │
│ │ Subsurface │ │ formatFeatureProps() │ │ zoning-flat │ │
│ │ Infrastructure │ │ SUBSURFACE_FORMATTERS │ │ risk-area │ │
│ └─────────────────┘ └─────────────────────────┘ └─────────────────┘ │
│ │ │
│ ┌──────────────────────────────────────────────────────────────────┐ │
│ │ Deck.gl + MapLibre │ │
│ │ ┌────────────────────────────────────────────────────────────┐ │ │
│ │ │ WebGL Rendering | GPU Acceleration | Interleaving │ │ │
│ │ └────────────────────────────────────────────────────────────┘ │ │
│ └──────────────────────────────────────────────────────────────────┘ │
│ │
└─────────────────────────────────────────────────────────────────────────┘
Elevation Levels:
+200m ┤ ████████ High Elevation (Skyscrapers)
+50m ┤ ████████ Medium Elevation
+15m ┤ ████████ Low Elevation (Buildings)
0m ┤ ████████ Surface (Zoning, Lots)
-20m ┤ ████████ Shallow Subsurface (Utilities)
-50m ┤ ████████ Deep Subsurface (Metro, Foundations)
Benchmarked on MacBook Pro M1 (2021):
| Features | FPS | Memory |
|---|---|---|
| 10,000 | 60 | 45 MB |
| 50,000 | 60 | 120 MB |
| 100,000 | 55 | 250 MB |
| 250,000 | 35 | 480 MB |
Run with npm run benchmark:
| Operation | Features | ops/sec | Mean (ms) |
|---|---|---|---|
| Zoning Layer Creation | 1,000 | 749,458 | 0.0013 |
| Zoning Layer Creation | 10,000 | 752,929 | 0.0013 |
| Building Layer Creation | 1,000 | 2,008,615 | 0.0005 |
| Building Layer Creation | 10,000 | 1,999,642 | 0.0005 |
| Subsurface Layer Creation | 1,000 | 1,958,089 | 0.0005 |
| Subsurface Layer Creation | 10,000 | 1,954,733 | 0.0005 |
| Elevation Filtering | 10,000 | 2,850 | 0.35 |
| Group by Network | 10,000 | 3,544 | 0.28 |
| ElevationController setRange | - | 5,284,545 | 0.0002 |
| isFeatureVisible (10k checks) | - | 220,372 | 0.0045 |
Key Takeaways:
- Layer creation is O(1) relative to data size (Deck.gl handles data internally)
- Filtering 10,000 features takes ~0.35ms
- ElevationController operations are extremely fast (<1 microsecond)
- Use
elevationRangeto filter non-visible features - Simplify geometries at lower zoom levels
- Use
minZoom/maxZoomon layers for LOD
| Browser | Version |
|---|---|
| Chrome | 90+ |
| Firefox | 88+ |
| Safari | 14+ |
| Edge | 90+ |
Requires WebGL 2.0 support.
This library collects anonymous usage data to help improve the product. We track:
- Library initialization and configuration
- Layer types used (not layer data)
- Errors and exceptions
- General usage patterns
What we DON'T collect:
- Geographic coordinates or locations
- User data or personally identifiable information
- Layer content or GeoJSON data
- IP addresses (PostHog anonymizes these)
You can disable telemetry in several ways:
// Option 1: Disable globally
import { disableTelemetry } from '@raphaeltorquat0/map-3d-deck'
disableTelemetry()

// Option 2: Via localStorage (persists across sessions)
localStorage.setItem('map3d_telemetry_optout', 'true')

// Option 3: Browser Do Not Track
// Telemetry respects navigator.doNotTrackTelemetry requires posthog-js. If not installed, telemetry is automatically
disabled with no impact on library functionality.
# To enable telemetry, install posthog-js
npm install posthog-jsWe welcome contributions! Please see our Contributing Guide for details.
# Clone the repository
git clone https://github.com/raphaeltorquat0/map-3d-deck.git
cd map-3d-deck

# Install dependencies
npm install

# Start development
npm run dev

# Run tests
npm test

# Build
npm run buildMIT © Raphael Torquato
Built with Deck.gl, MapLibre GL, and TypeScript