Skip to content

Upgrade to highcharts 7#162

Merged
cfarm merged 4 commits intomasterfrom
upgrade_to_highcharts_7
Mar 28, 2019
Merged

Upgrade to highcharts 7#162
cfarm merged 4 commits intomasterfrom
upgrade_to_highcharts_7

Conversation

@anselmbradford
Copy link
Member

@anselmbradford anselmbradford commented Dec 11, 2018

Removals

  • Removes translation transforms made obsolete by highcharts 7.

Changes

  • Upgrades @babel/core, @babel/preset-env, autoprefixer, require-dir.
  • Upgrade highcharts dependency to version 7.
  • Adds styledMode attribute as needed in highcharts 7.

Testing

  • Run ./setup.sh && gulp build && gulp watch
  • Visit http://localhost:5000/ and resize the page to see responsive sizes. Check in Chrome, FF, IE10+, Edge, iOS simulator.
  • Interact with charts by hovering and checking applicable interactive bits.

Test on cfgov-refresh

  • Pull down this branch.
  • Check out https://github.com/cfpb/cfgov-refresh/tree/upgrade_babel branch on cfgov-refresh
  • Run ./frontend.sh
  • Replace cfgov-refresh/node_modules/cfpb-chart-builder with cfpb-chart-builder base directory from this branch.
  • Run gulp clean && gulp build
  • Visit CCT pages and mortgage performance trends on localhost.

Screenshots

GeoMap zoom buttons are slightly different:

Before

screen shot 2018-12-11 at 3 51 34 pm

After

screen shot 2018-12-11 at 3 51 29 pm

LineChart tooltips now have bold values to match the bar chart tooltips:

Before

screen shot 2018-12-11 at 3 20 16 pm

After

screen shot 2018-12-11 at 3 20 26 pm

Whole demo page (Desktop):

Before

Desktop Before

After

Desktop After

Whole demo page (Mobile):

Before

Mobile Before

After

Mobile After

Note

  • If you compare the before/after screenshots you'll see there is vertical shifting that's happening of a few pixels. I fixed this for projected values label and the x-axis label at desktop, but not sure if it matters elsewhere. Perhaps at mobile? It's subtle and easiest is probably opening the before and after images in two tabs, zoom each in, scroll them to the same chart, and ctrl+tab between them to see the difference. There's also some line charts that have a different rendering for the y-axis. The data is not changed, but it's presentation is shifted from this, so not sure if that matters either.

Before:
screen shot 2018-12-11 at 5 03 01 pm

After:
screen shot 2018-12-11 at 5 02 52 pm

@anselmbradford
Copy link
Member Author

I don't get the codecov/patch check, but it can be ignored here.

@cfarm cfarm self-assigned this Feb 21, 2019
@cfarm
Copy link
Contributor

cfarm commented Mar 13, 2019

Testing in Sauce at different sizes in

  • Chrome
  • FF
  • IE11
  • Edge
  • iOS simulator

@cfarm
Copy link
Contributor

cfarm commented Mar 13, 2019

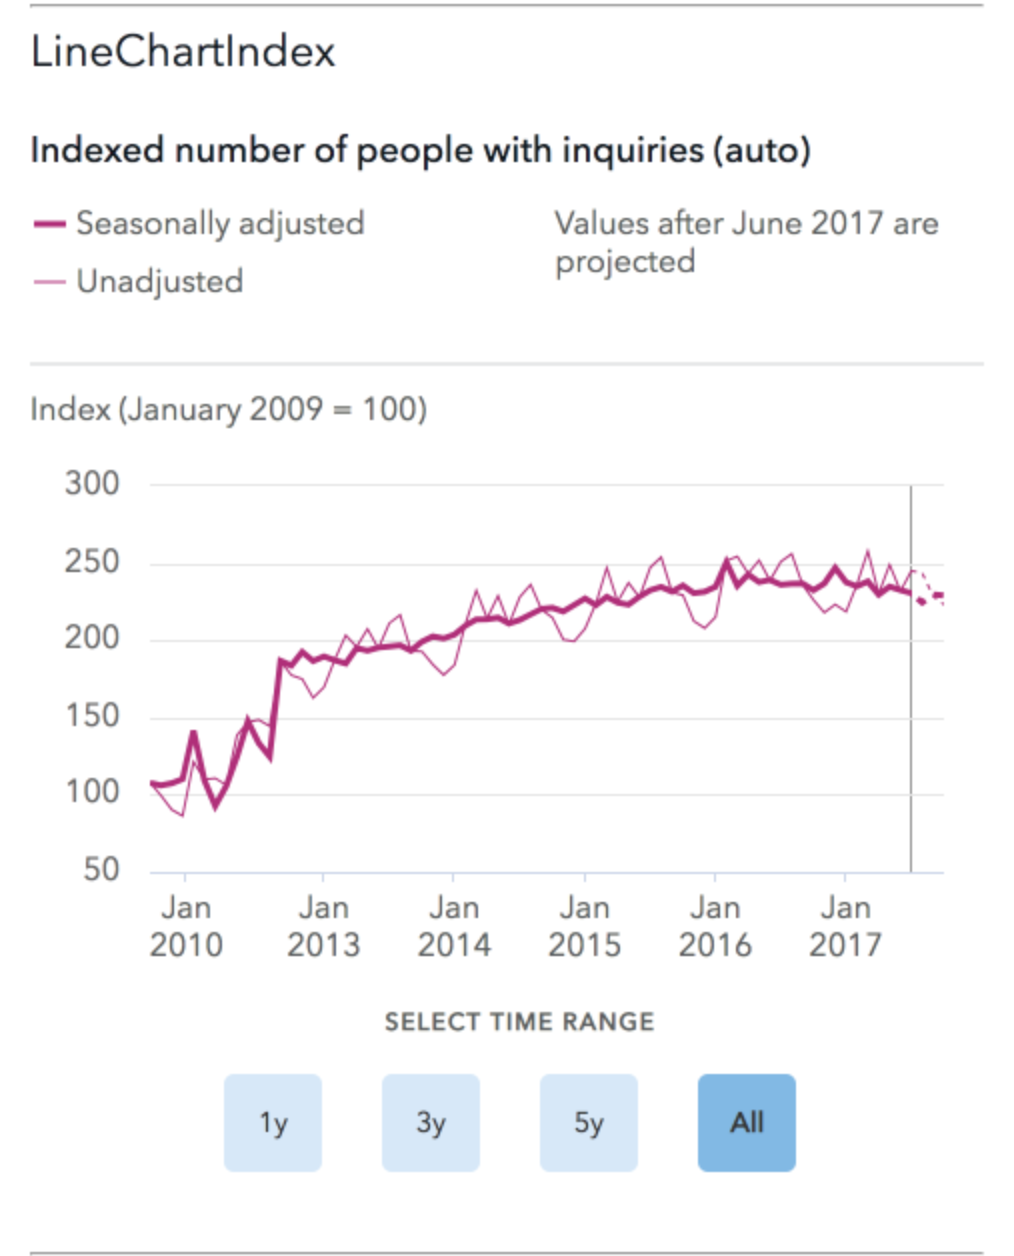
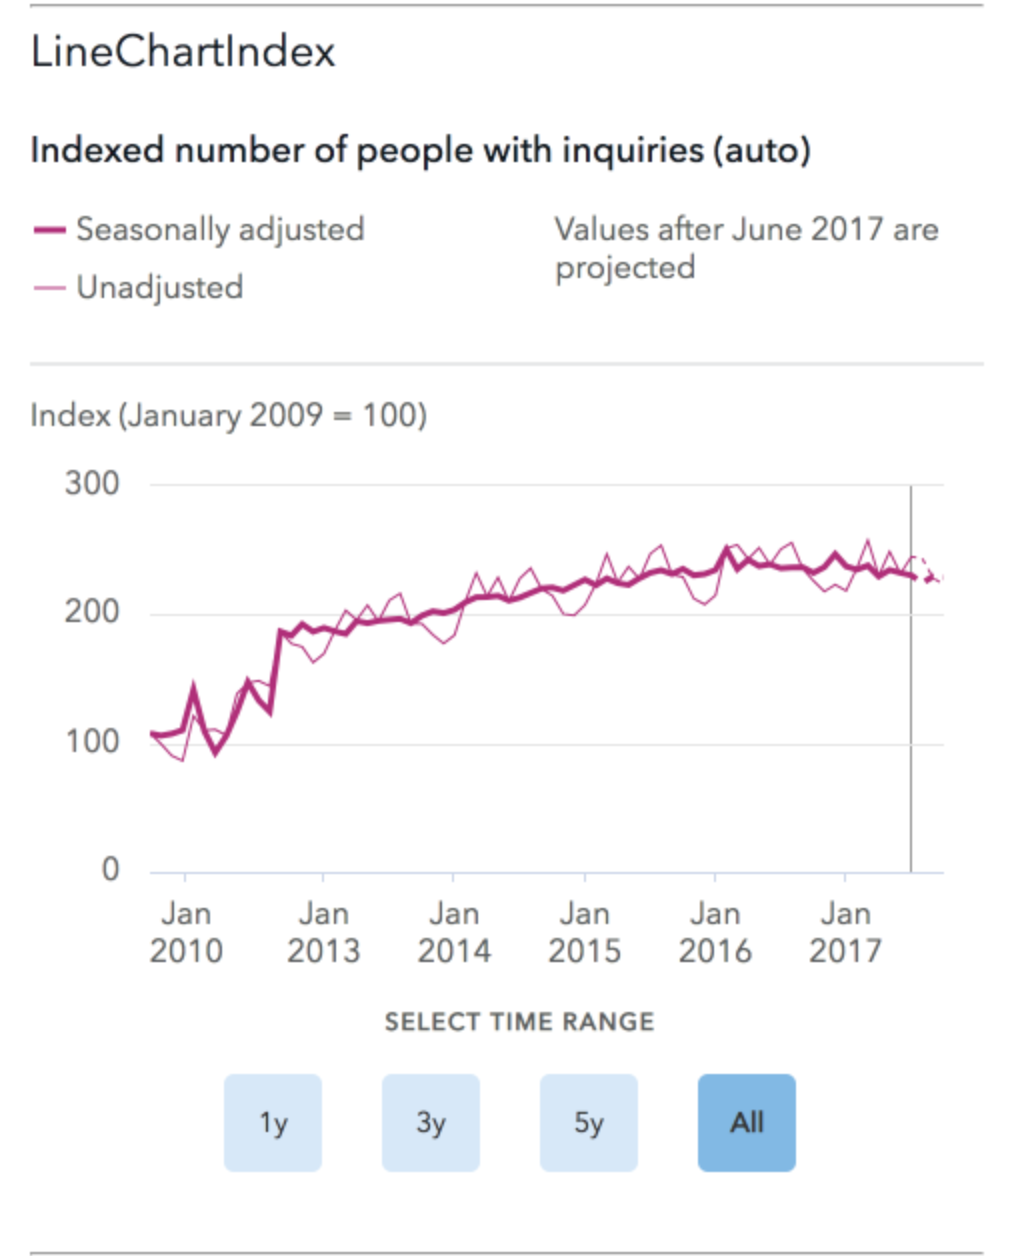
That last example of the screen shots of the LineChartIndex chart shows the Y axis changes from 0 to 50 as the baseline. I remember having consistent axes was a discussion early on in the Data & Research project,, but if you look at the wide variety of data and how it is reflected with different axis values across the charts now, I think that ship has already sailed. Otherwise I don't see the 'pixel shifting' issue being a problem.

[review continues]

@cfarm
Copy link
Contributor

cfarm commented Mar 13, 2019

One thing I might edit on this branch is to pull in the change from #164 doneso with merge from master

Copy link
Contributor

@Scotchester Scotchester left a comment

Choose a reason for hiding this comment

The reason will be displayed to describe this comment to others. Learn more.

This is all working for me localy, both standalone and in cfgov-refresh!

@cfarm cfarm mentioned this pull request Mar 25, 2019
25 tasks
@cfarm
Copy link
Contributor

cfarm commented Mar 25, 2019

Looking at https://github.com/cfpb/cfgov-refresh/compare/upgrade_babel#diff-b9cfc7f2cdf78a7f4b91a753d10865a2 which contains the changes described in this PR too:

Upgrades @babel/core, @babel/preset-env, autoprefixer, require-dir.

these changes were made in November, before cfgov-refresh moved from npm to Yarn in February: cfpb/consumerfinance.gov#4346

I'm trying to find out if that has any implications for those changes, since it seems we need to get that branch merged in cfgov-refresh before we can merge and release this PR's changes.

@cfarm
Copy link
Contributor

cfarm commented Mar 25, 2019

This open PR also upgrades babel: cfpb/consumerfinance.gov#4836 but the tests are failing.

@cfarm
Copy link
Contributor

cfarm commented Mar 27, 2019

Successfully have this branch working with cfgov-refresh on the master branch - so looks like the upgrade_babel branch isn't needed for this.

@cfarm
Copy link
Contributor

cfarm commented Mar 27, 2019

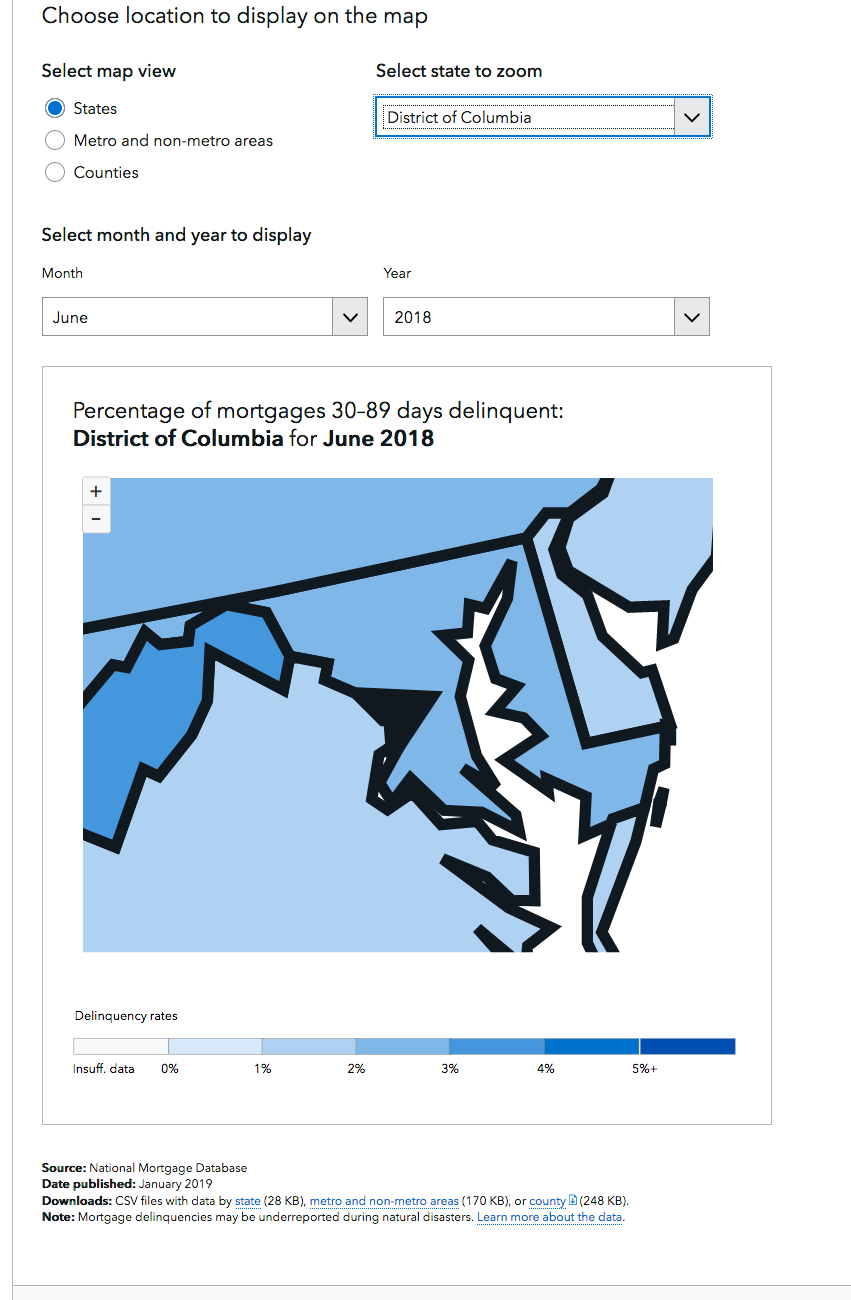
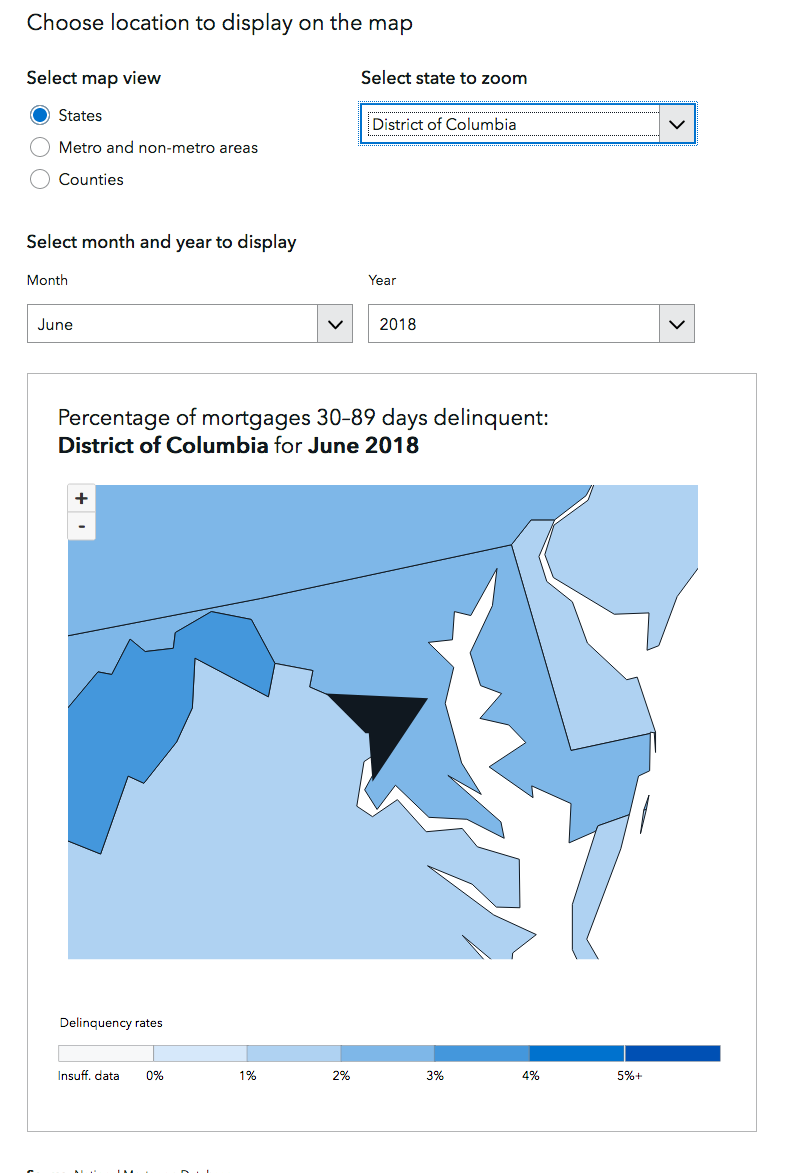
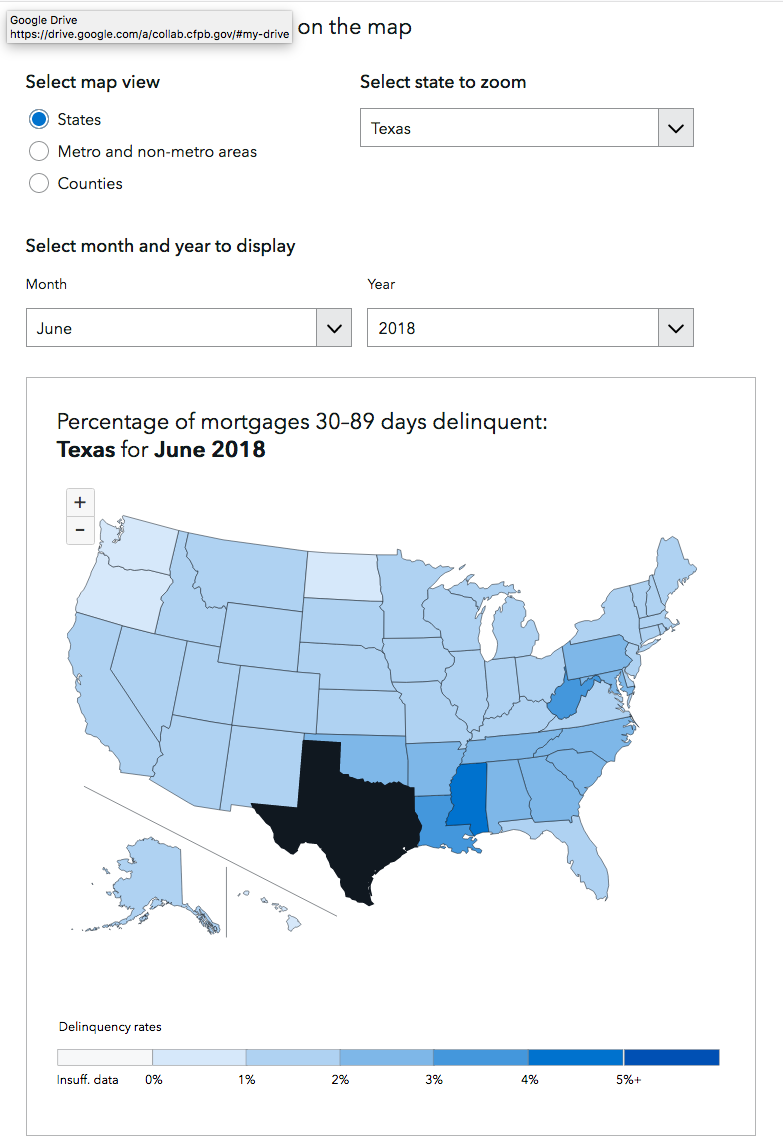
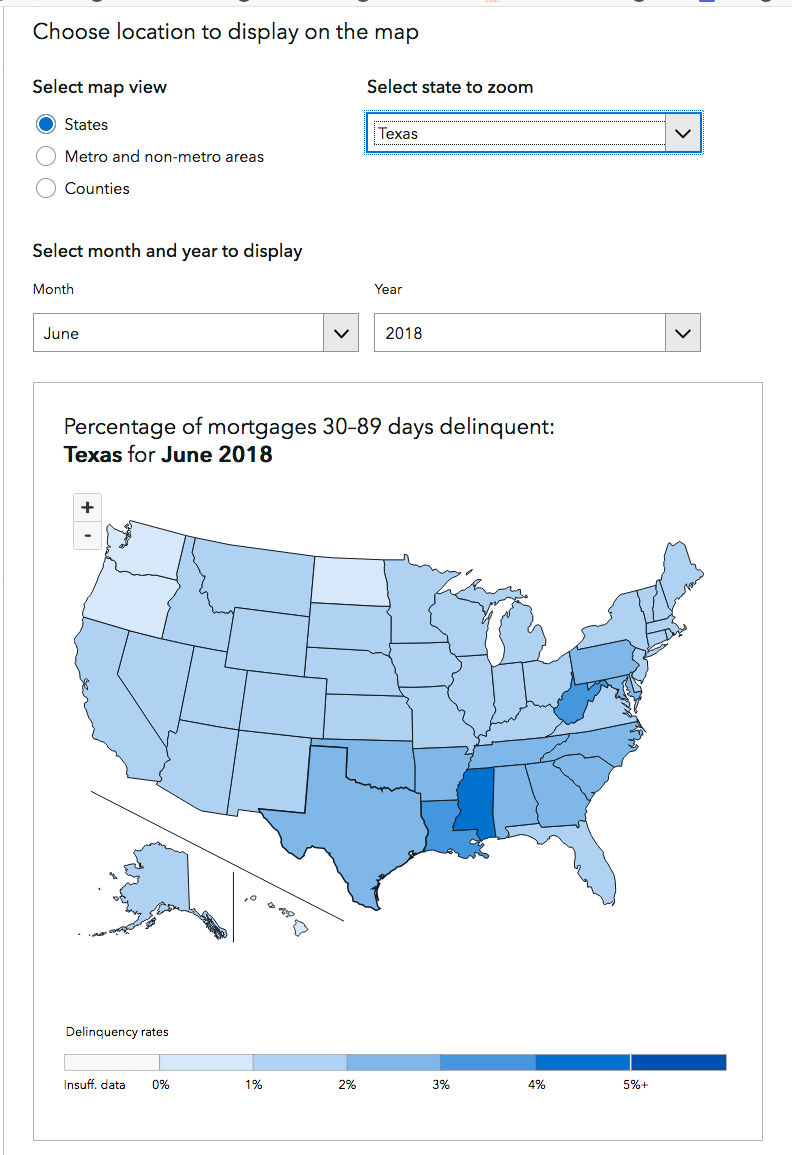
Differences noticed in this branch vs the live site - in Firefox for Mac:

Mortgage performance map - zoomed in state/map lines are thicker in this branch when zoomed in, like for small states in the "States" view:

This PR www
Screen Shot 2019-03-27 at 6 55 06 PM Screen Shot 2019-03-27 at 6 56 22 PM

When a state is selected, it has a black fill on this PR, but on the live site it just has a bolder outline:

This PR www
Screen Shot 2019-03-27 at 7 01 17 PM Screen Shot 2019-03-27 at 7 01 12 PM

The same thing happens for selected counties & metro areas

@cfarm cfarm merged commit 6ffb153 into master Mar 28, 2019
@Scotchester Scotchester deleted the upgrade_to_highcharts_7 branch April 1, 2019 19:22
Sign up for free to join this conversation on GitHub. Already have an account? Sign in to comment

Labels

None yet

Projects

None yet

Development

Successfully merging this pull request may close these issues.

3 participants