Project : PANDEMIC PREDICTX Pandemic Insights Redefined: Leveraging Machine Learning for Global Health Security
Team: Insight Seekers
The Given Problem
COVID-19 is the fifth documented – and one of the most devastating – pandemic since 1918, As of 5th July 2023, there have been 767,726,861 confirmed cases of COVID-19, including 6,948,764 deaths, reported to WHO. Understanding the trend of how, why, when and where this pandemic spread is essential to tackling similar situations in the future, and making our world a safer place to live in.
The Vaccinations Dataset, sourced from the Centers for Disease Control and Prevention (CDC), a division of the US government, is a comprehensive repository of vital immunization information. This dataset boasts an impressive scale, encompassing a staggering 1,962,781 rows and a rich array of 80 columns. Within its extensive data structure, it meticulously documents the vaccination records of individuals residing in diverse counties across the United States. This invaluable resource plays a pivotal role in tracking and analyzing the distribution and administration of vaccinations.
The Mobility Dataset, sourced from Google Mobility Reports, serves as a dynamic reflection of the profound shifts in human activities observed during the course of the pandemic. This expansive dataset, initially comprising a substantial 2,112,154 rows and 17 columns, comes into sharper focus as 122,570 rows and 17 columns specifically pertain to the United States, aligning seamlessly with our specific use case. These meticulously curated data entries provide a comprehensive and granular view of how people's mobility behaviors evolved and adapted throughout the pandemic, offering a valuable resource for analyzing and understanding the impact of various restrictions, public health measures, and societal changes on daily life and movement patterns in the United States.
The Covid Cases Dataset, generously supplied by the New York Times, is a comprehensive record of the impact of the Covid-19 pandemic across the United States. This dataset comprises a substantial 292,004 rows and 6 columns, meticulously documenting the daily progression of Covid-19 cases and related fatalities in every county of the country. Spanning from the tumultuous year of 2020 to 2022, it offers a vital resource for tracking the evolution of the pandemic's toll on public health, enabling in-depth analyses and research into the geographical and temporal patterns of infection and mortality rates. This dataset serves as a critical tool for understanding the multifaceted impact of Covid-19 on different regions within the United States over this extended timeframe.
The Population Dataset, sourced directly from the US Census Board, furnishes comprehensive information about the demographic landscape of the United States. This dataset offers a detailed account of both population figures and land area measurements for every county across the nation. It serves as a fundamental resource for gaining insights into the size, distribution, and geographic characteristics of the US population, facilitating a deep understanding of regional demographics and their trends.
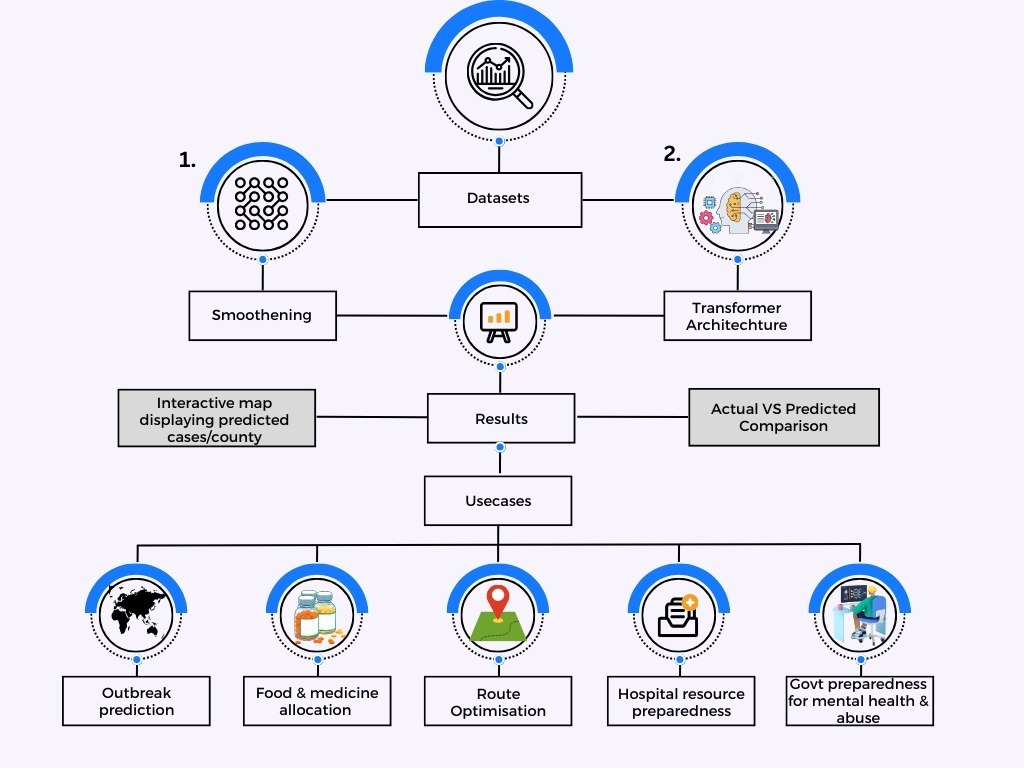
Our methodology comprises a two-fold approach to address the complex challenges posed by the COVID-19 pandemic:
1. Predictive Modeling with Transformers:
To forecast the potential number of future COVID-19 cases over specific time windows (e.g., one week or one month), we employ a state-of-the-art Transformers architecture. This choice is driven by the model's ability to capture long-term dependencies in time series data, which is crucial for mitigating noise and accounting for seasonality in the pandemic's progression. To enhance data quality, we apply a 7-day moving average to smoothen the time series data by removing the noise, which is then used as input sequences for the Transformer model. The model is trained on 80 percent of the available data and evaluated on the remaining portion. We evaluate model performance using the Root Mean Square Error (RMSE) relative to the mean of the actual test data values, expressed as a percentage. The resulting error rate is approximately 1.25% for most counties, indicating a high level of predictive accuracy. Error = (RMSE of model on test data/ Mean of actual values of test data)*100
2. Risk Assessment and Visualization:
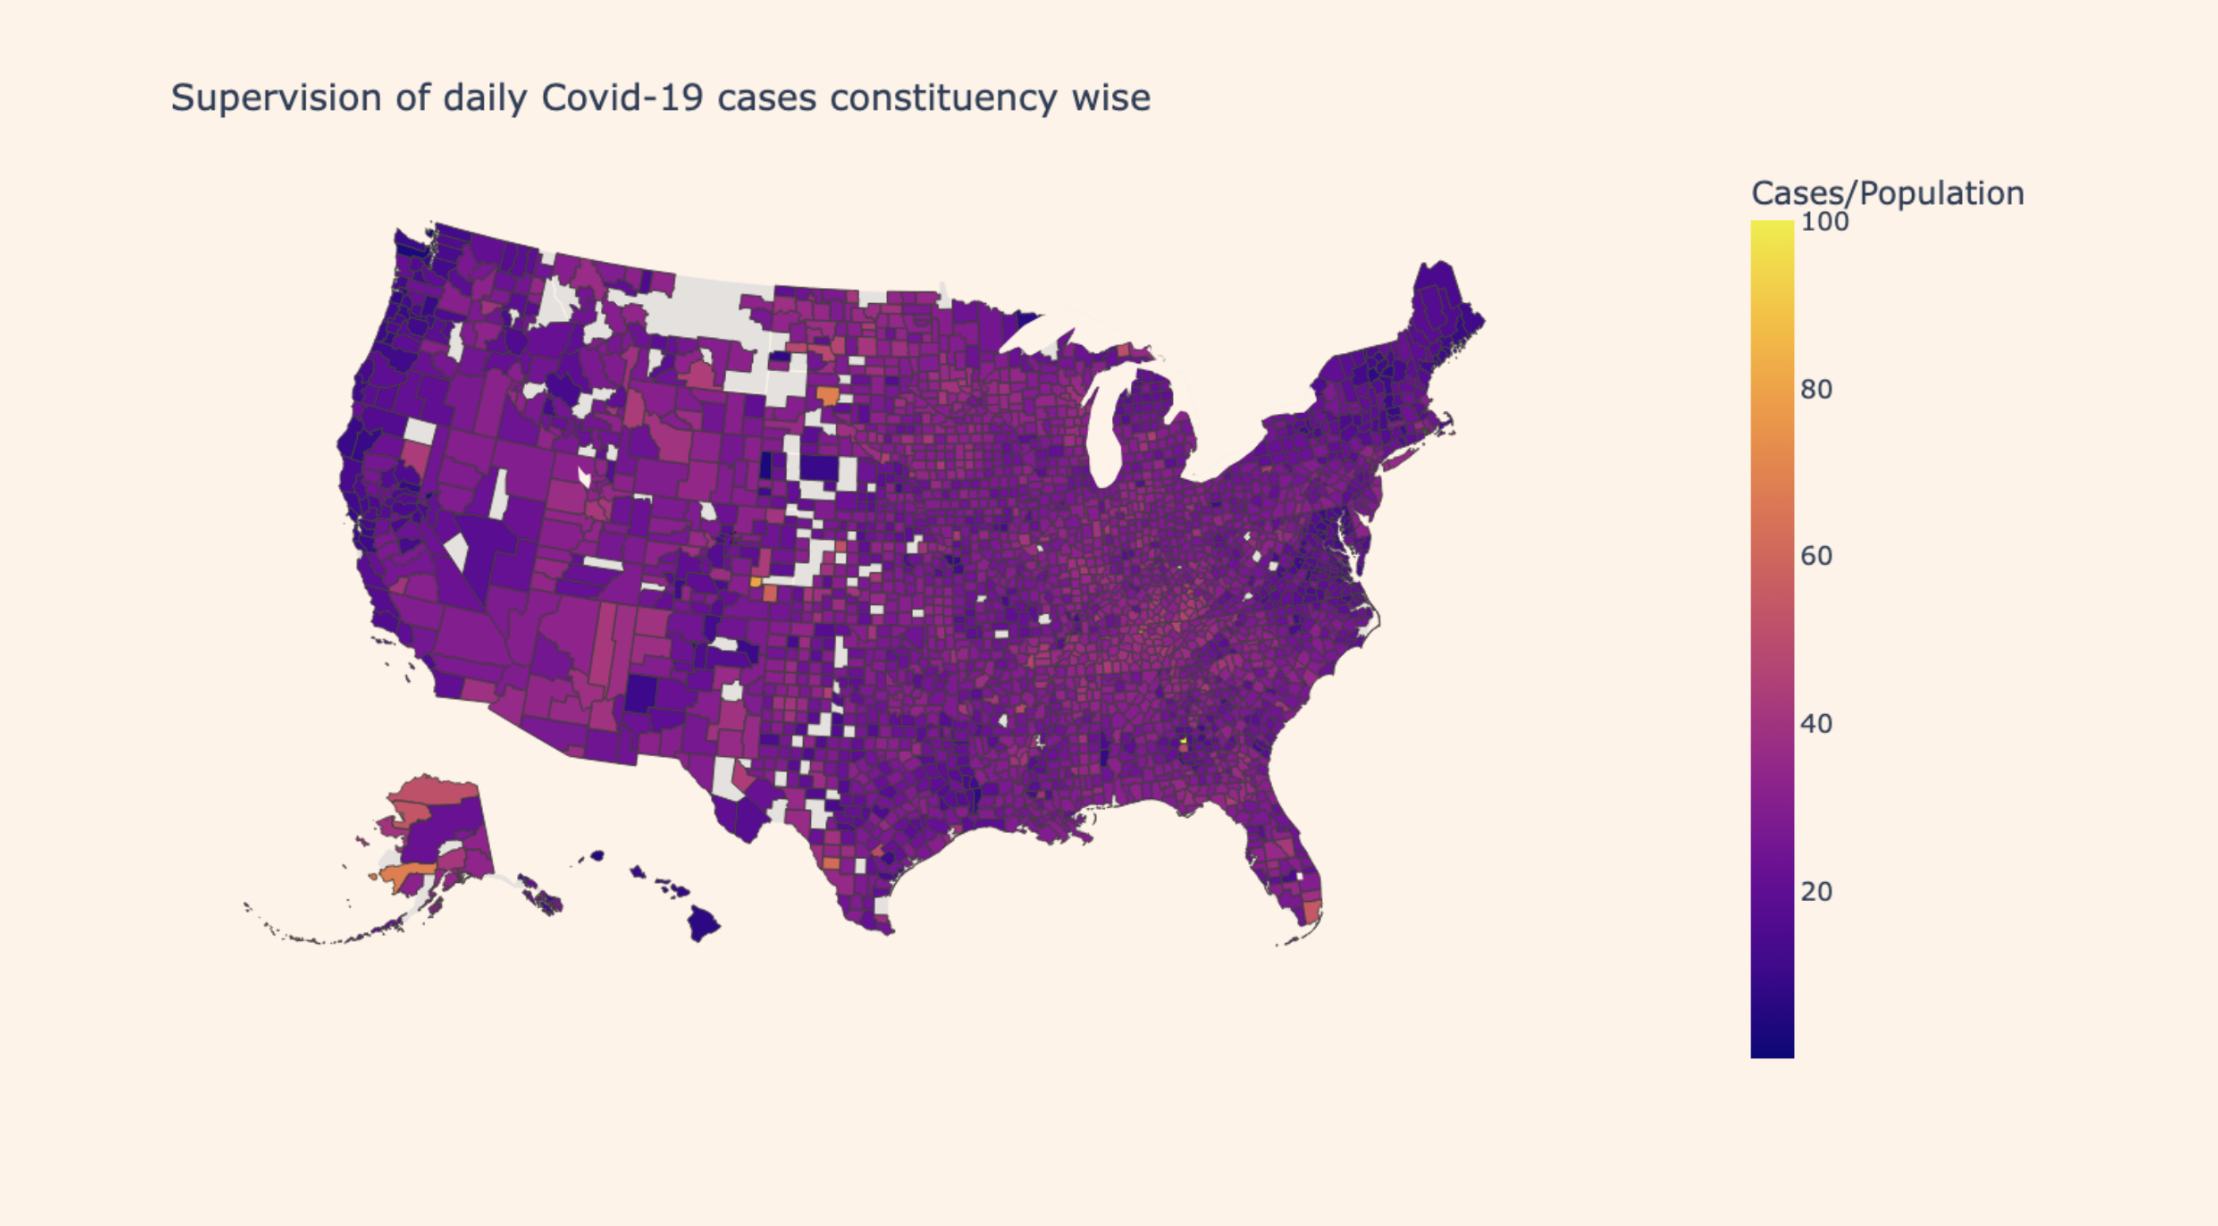
Our approach extends to making predictions for all counties in the United States for the next six months using the trained model. This can be similarly done for India as well. The predicted data is then visualized on an interactive map platform using Plotly. This map serves as a risk assessment tool, displaying the per capita probability of infection (risk) for each county.
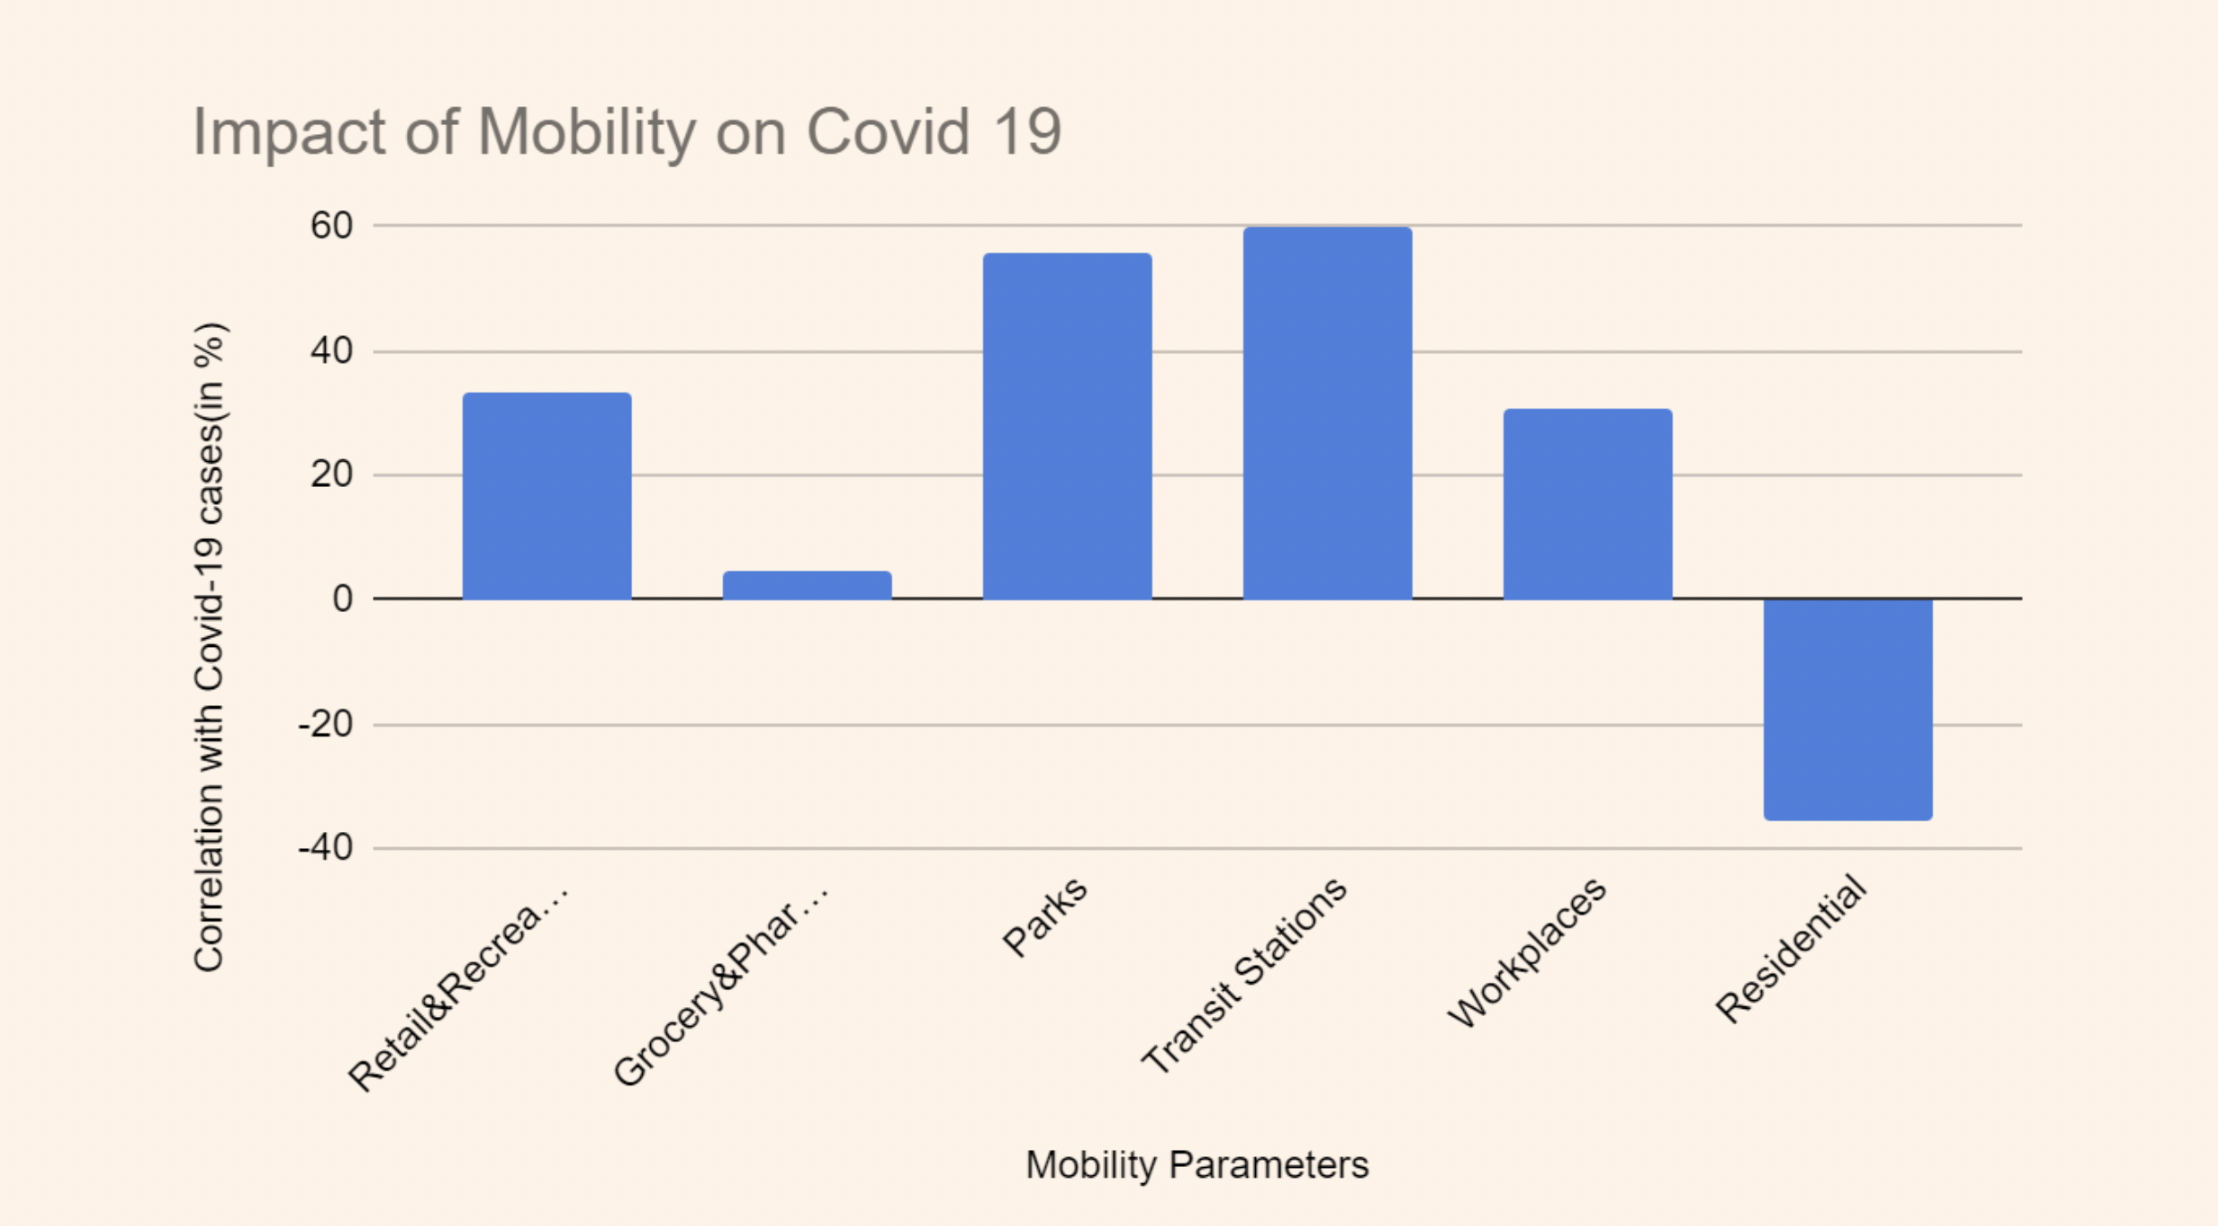
The risk is calculated as the predicted number of cases in a county divided by the population of that county. This interactive map provides a valuable resource for both government authorities and the public. It aids in policy implementation by enabling informed decision-making and assists the public in taking appropriate precautions based on localized risk levels. Risk = Prediction of Cases in county/Population of the county To gain deeper insights into the factors driving spikes in COVID-19 cases, we incorporate additional time series data sources such as mobility datasets, which capture changes in mobility across various areas like transit stations, workplaces, pharmacies, and grocery stores etc. We also include vaccination data. To identify correlations between these factors and case numbers, we employ the Kendall Tau correlation method. This analysis helps us understand the impact of different mobility factors on case spikes, empowering government bodies to implement targeted restrictions on activities that contribute to case surges while permitting those with minimal impact. This approach enhances our understanding of the pandemic's spread within specific regions, facilitating more effective containment strategies.
Time series data often contain noise, which refers to random or irregular variations in the data that do not represent any meaningful underlying pattern or trend. For this specific case of Covid-19 analysis, noise can make it challenging to extract information and patterns from time series data, and can lead to inaccurate predictions or analyses. Thus, we use Transformer architecture to make predictions using the data.
Some of the advantages of using transformer architecture over time-series are:
-
Attention mechanisms: Transformers use self-attention mechanisms to weigh the importance of different elements in the input sequence when making predictions. This allows them to capture long - range dependencies and ignore noisy or irrelevant data points.
-
Parallelization: Transformers can process data in parallel, which makes them efficient for training on large datasets like ours.
-
Transformers can incorporate temporal information through positional encodings which helps them understand the sequential nature of time series data.
Apart from this, to identify correlations between various factors and case numbers, we employ the Kendall Tau correlation method. This analysis helps us understand the impact of different mobility factors on case spikes, empowering government bodies to implement targeted restrictions on activities that contribute to case surges while permitting those with minimal impact. This approach enhances our understanding of the pandemic's spread within specific regions, facilitating more effective containment strategies.
1) Outbreak prediction based on disease spread rate
Using the datasets mentioned, the origin of it in the country and the R number for a microbe-generated disease like Covid, geography-based prediction of the spread of the disease has been predicted, which can help in formulating suitable plans for implementing lockdown measures by the Government.
2) Resource allocation
Using the spread rate predicted and the population density of various districts, the government can estimate the allocation and distribution of resources such as food and medicine. This prediction will help district authorities adequately prepare and equip people in each district to effectively navigate through the lockdown period.
3) Transportation route optimisation based on the google mobility report
By utilizing the Google Mobility report and integrating it with the Google Maps API, we can suggest optimal transportation routes to citizens and government vehicles likewise. These routes can be recommended in order to avoid hotspots and ensure the efficient transportation and distribution of essential resources to different locations.
Due to budget constraints and limited project resources, we made the decision not to implement the Google Maps API in this project since it is a paid requirement. We are committed to delivering a high-quality project within the given constraints and have sought to maximize the available resources to provide meaningful insights and functionality to our users. But using Google Maps API could have proven to be a huge boost to our project.
4) Helping hospitals prepare & managing manufacturers' supply chain
Using the R number and the rates at which patients need treatment, an estimate of patient influx can be suggested to the hospitals by the governemnt. This will help them be better prepared with medical resources like hospital beds, masks etcetera.
With our solutions’ help, the Government can plan out appropriate ways to obtain resources from nearby manufacturing units and managing their supply chain. This can be done by obtaining a nation-wide data of hospital bed manufacturers and their weekly capacity.
5) Ensuring Government preparedness to tackle mental health & abuse case
Reports suggest a significant rise in cases of mental health issues, child abuse and domestic violence cases. With our solutions, once the Government is aware of the predicted threat of lockdown, the authorities can put adequate resources in place considering factors such as lockdown duration, AQI, financial strata and more of an area. In this way, we can help the Government be better prepared with the human resources required to tackle such issues. This includes special toll-free numbers for mental health experts, police personnel etc.
https://raw.githubusercontent.com/nytimes/covid-19-data/master/us-counties.csv
https://www.gstatic.com/covid19/mobility/Global_Mobility_Report.csv
https://data.cdc.gov/api/views/8xkx-amqh/rows.csv
Transformers
Kendall Correlation
Sklearn (Intel Patched Scikit Learn)
Tensorflow (Intel TensorFlow Kit)
Pandas (Modin)
Plotly
Scipy
Numpy
Scipy for Correlation analysis
Plotly for plotting real time interactive maps and graphs