Antenna Signal Analysis, Perform various calculation using Python
The main role of the project deals with the RADAR raw data analysis and signal processing for all range gates. The multiple aims of the project are, plotting the power and spectra of the raw data for all range gates, application of coherent integration, performing auto and cross-correlation, calculation of the angle-of-arrival .
Main target to perform auto-correlation, corss-correlation, discuss about power distribution, Power Spectral Density, Fast Fourior Transform, Coherent Integration, Angle of Arrival,
Tasks for this project version June 18th
RAW data analysis and signal processing <
-
Plot the power of the raw data for all range gates, temporal samples and both polarisation, but only receiver 1 (index 0) -> e.g. pcolor plots -> select ONE interesting raw data portion (one experiment run), where most echoes are visible, -> use this selected data for all the subsequent tasks!
-
Spectra over range for the receiver channel 1 and the spectral average of channel 2-4 -> e.g. pcolor plots
-
Apply a suitable number of either coherent integrations or incoherent integration (Low pass filter version) -> show resulting spectra, equivalently to task 2)
-
Derive the spectral width of the observed spectra for receiver 1 after applying integrations -> assume a gaussian distribution, fit this gaussian (varying the position (Doppler shift) and width -> plot the width and found Doppler shift along the ranges (line plots)
-
Show the autocorrelation for receiver 1 and one of the other for all ranges -> e.g. 2x pcolor figure
-
Perfom the crosscorrelation for all combinations of receiver channel 2-4 find the maximum amplitude show in a line plot the position of found maximum, as well as corresponding amplitudes and phases for each range
-
Show the cross-spectra for all combinations of receiver channel 2-4 in amplitude and phase, apply suitable SNR-cleaning for beautiful figure
-
Calculate the angle-of-arrival for all ranges using receiver channel 2-4 plot the found positions, apply suitable SNR-cleaning
Fig1. Power graphs for Rx 1 for all range gates for each step of data and polarisation.
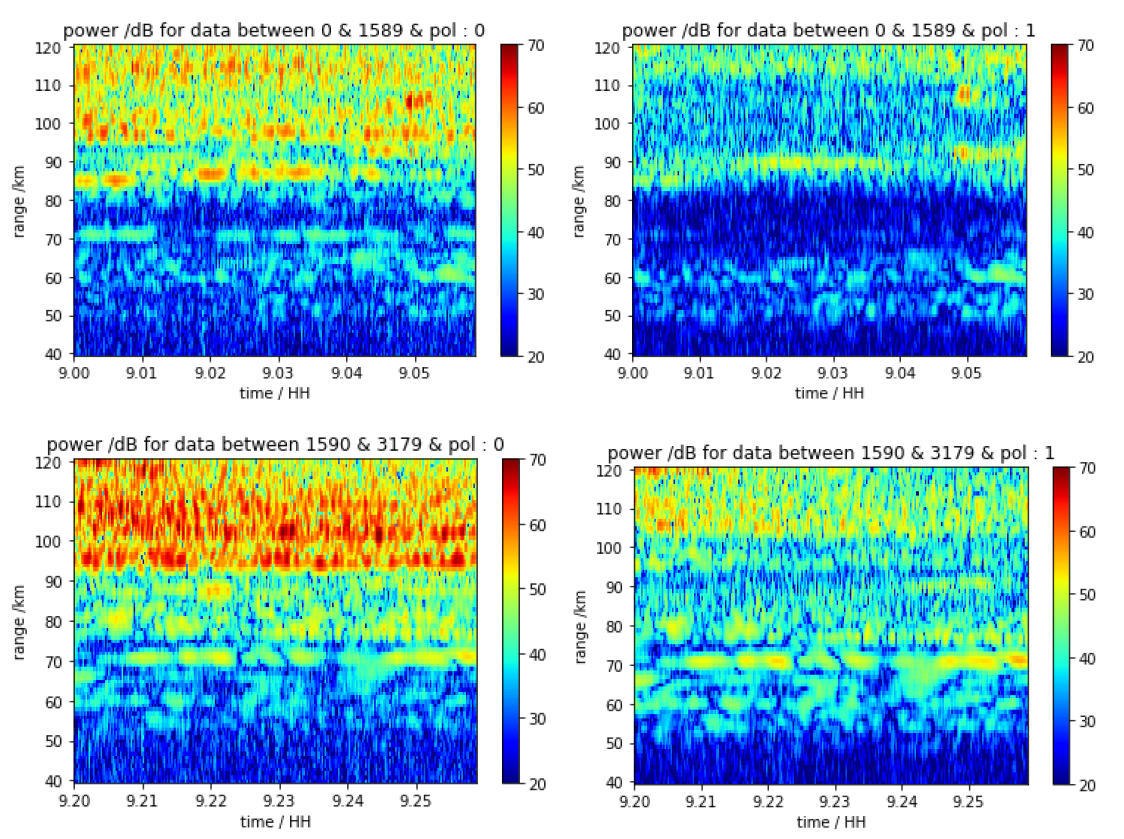

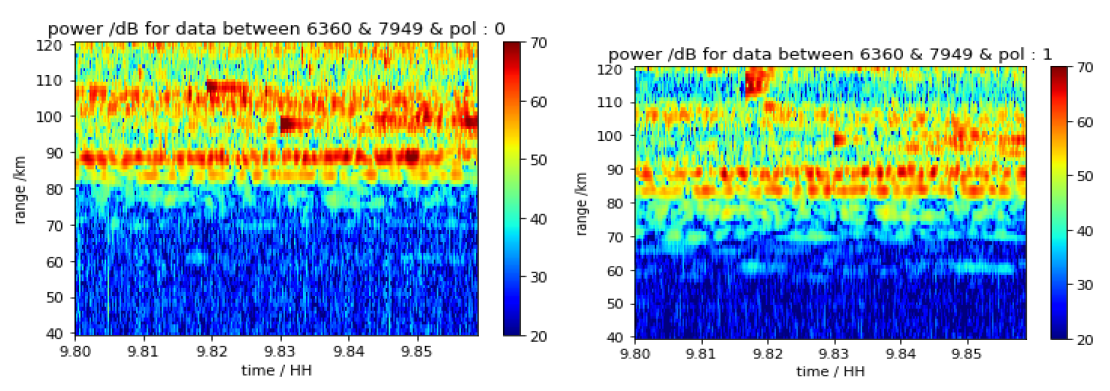
Fig2. Power graphs of Receiver 1 and the average of Receiver 2,3 & 4.

Fig3: Spectra for all receivers before and after Integration

Fig4: Power and Phase graphs for autocorrelation
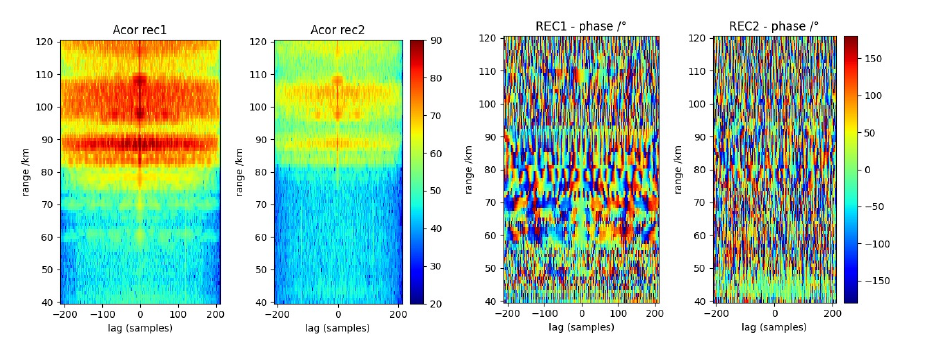
Fig5: Cross-Correlation of all the gates for selected data
Fig6. Cross- spectra after SNR thresholding

Fig7. Angle of arrival for Channel 2-4
