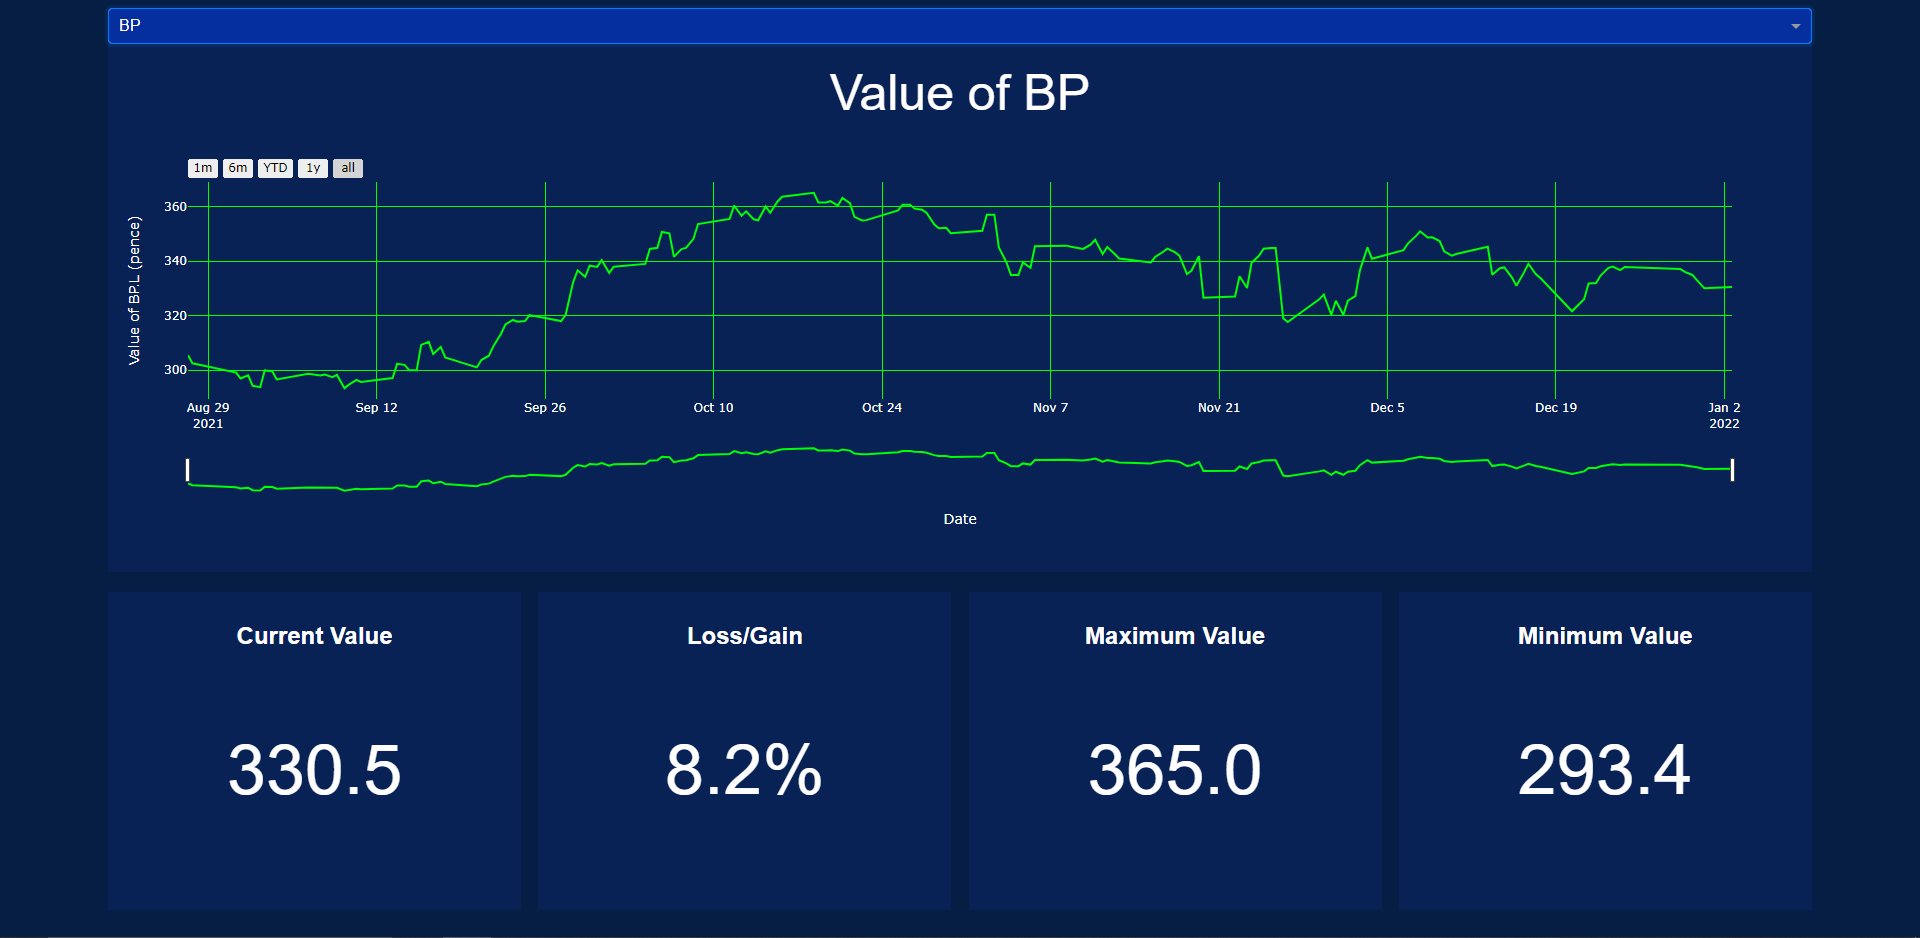
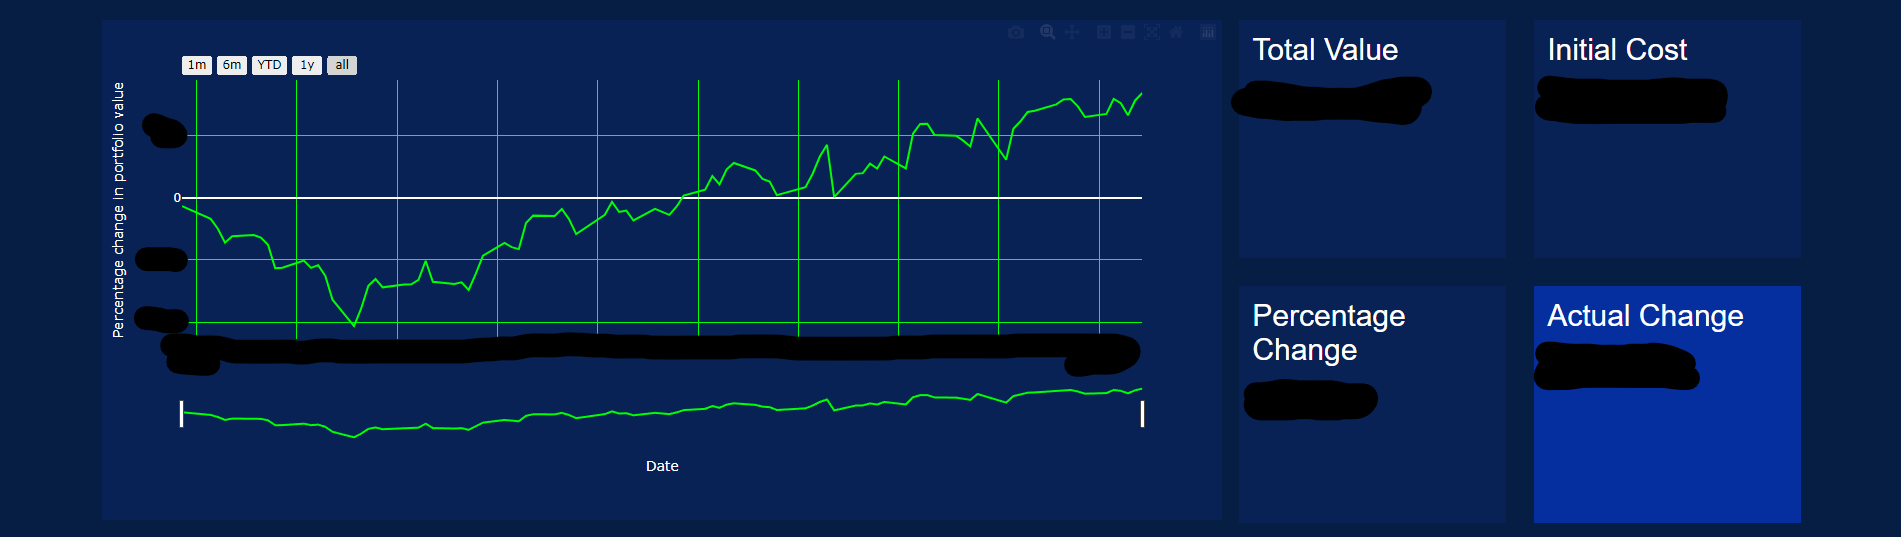
A Python application that uses Plotly/Dash to display the value of a portfolio of stocks over a period of time
Stock data is taken from Yahoo Finance via the yahoo-fin library. Currency data is taken from exchangerate.host. All data is cached where possible to reduce api calls.
Portfolio data should be stored in a file called portfolio.json in the same directory as app.py. The file should be a list of objects, with each object having the follwing format:
{
       "name": str,
       "ticker": str,
       "currency": str,
       "date_bought": str (yyyy-mm-dd),
       "date_sold": str (yyyy-mm-dd) or null,
       "holding": int,
       "book_cost": float,
       "commission": float (amount of currency),
       "fx_charge": float (percentage),
       "exchange": str
}
 (Some details redacted for privacy)