Polygon plotting in static mapping packages not plotting in leaflet #631
Description
I ran the following reproducible lines of code and got this:
library(sf)
library(leaflet)
library(osmdata)

roundhay_park_all = opq("leeds") %>%
  add_osm_feature(opq = ., key = "name", value = "Roundhay Park") %>%
  osmdata_sf()

roundhay_park_multipoly = roundhay_park_all$osm_multipolygons
roundhay_park_poly = roundhay_park_multipoly %>%
  st_cast("POLYGON")

leaflet() %>%
  addTiles() %>%
  addPolygons(data = roundhay_park_poly)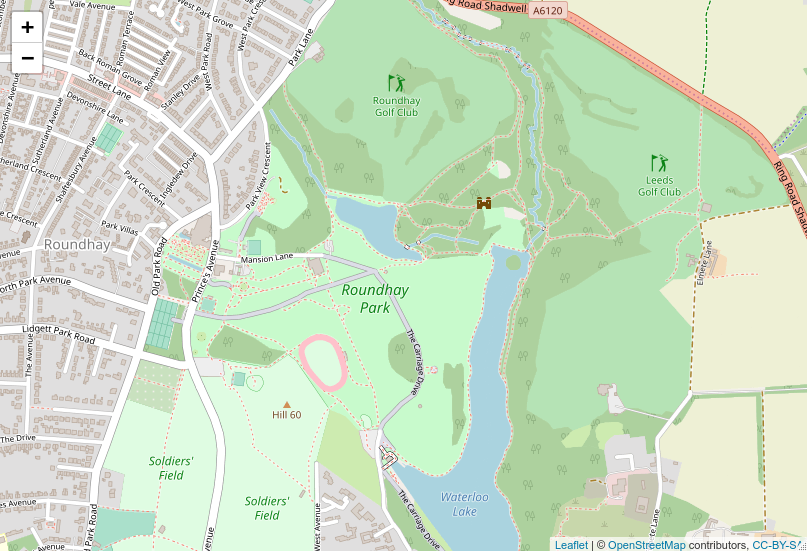
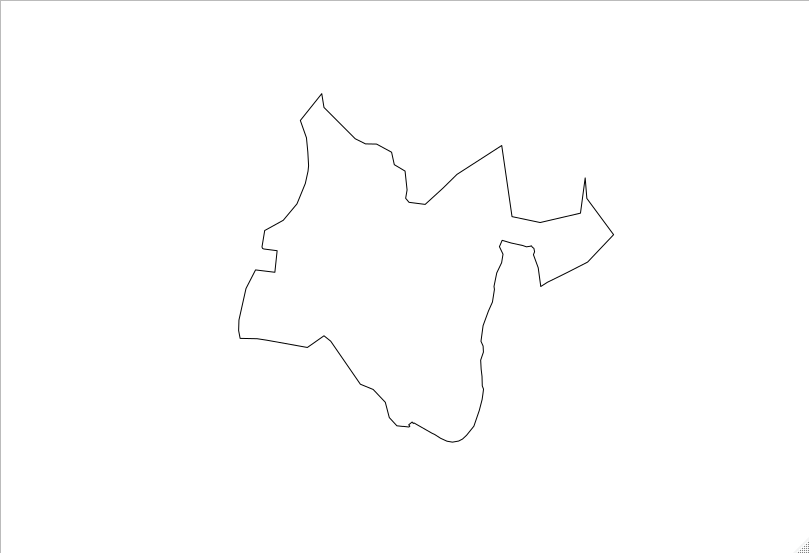
I expected something like this (the shape of Roundhay Park):
plot(roundhay_park_poly$geometry)