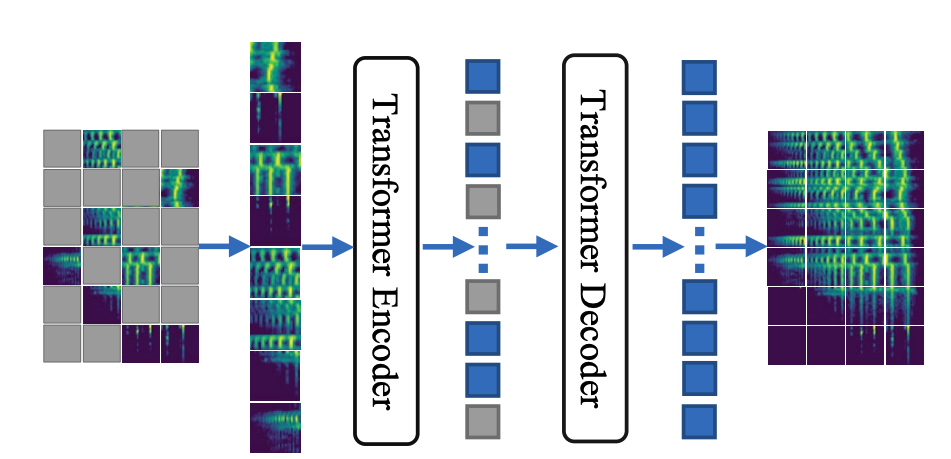
Visualizing predicted spectrogram #1
Description
Dear authors,
I am trying to run MaskSpec on a single audio file as a demo. I want to visualize output similar to the one shown in the README. However, I am not getting desired results with a pre-trained model. Can you please help me figure this out?
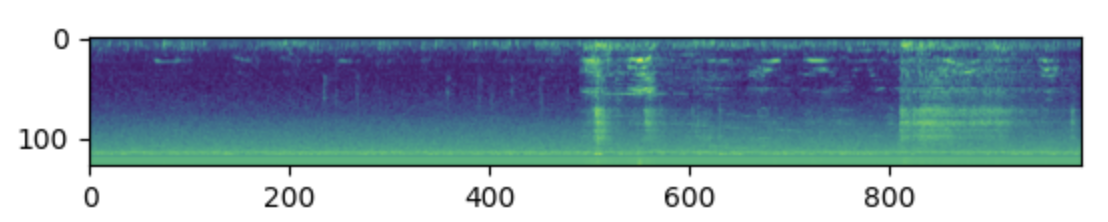
Input spectrogram:
Mask overlaid onto input:

Output from the model (pred):

I have used code snippets from the pre-training code and audioset/dataset.py. I will be happy to share my code if that helps.