Last item in bar graph takes incorrect gradient when average shown and 2 or fewer locations #1222
Description
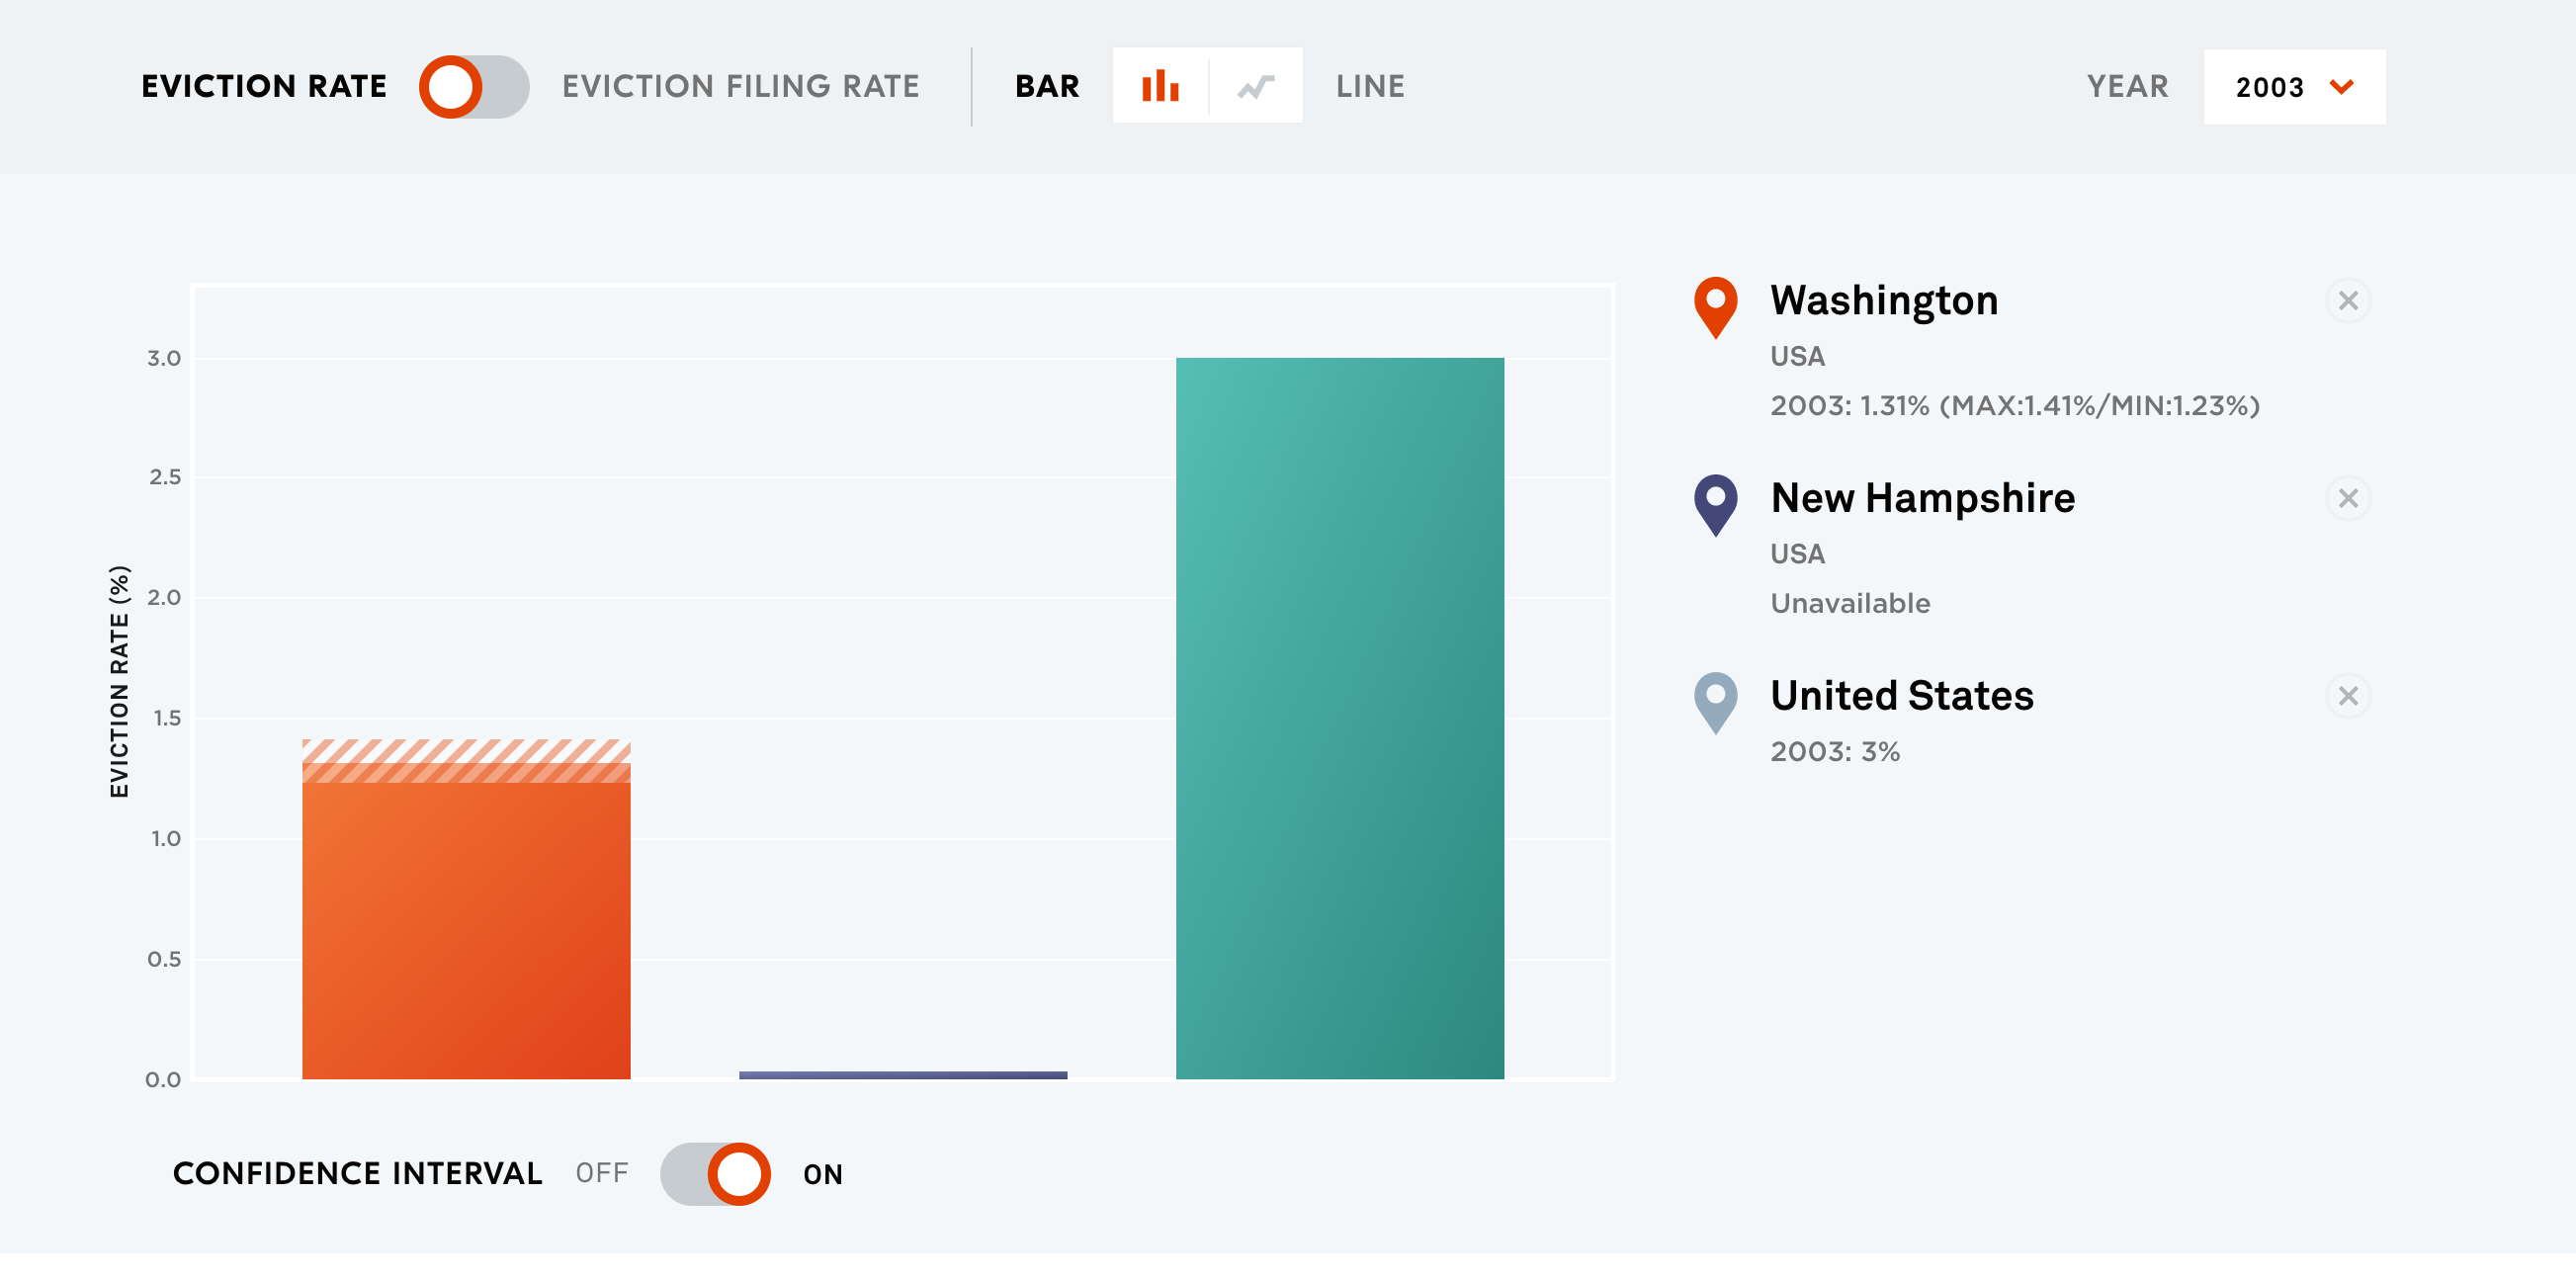
When the US average bar is shown, but only one or two locations have been selected, and the bar graph is displayed, the last bar takes the designated location color (purple or green), instead of the US average color (gray).
I've tried a simple .average-show .bar:last-of-child selector when <app-graph> has the class .average-shown, but it doesn't seem to work. Possibly because of class encapsulation issues, possibly because the fill assignations to be overridden use a slightly more specific class: .bar-0 & etc.